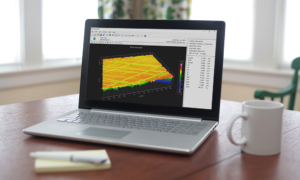
Surface analysis when working remotely
When you send parts to a measurement lab, you likely receive back a PDF file with some parameter values, and maybe a part profile. That’s probably just enough information for you to show whether the parts meet spec. But you aren’t likely to get any real sense of how that surface looks, feels, or performs.
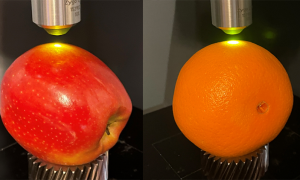
Comparing apples and oranges?
A properly scaled photo or graph can give great insight into surface texture features. An improperly scaled image, however, can get you running in circles. If you are trying to compare process data, an incorrectly scaled image may (incorrectly) suggest a change with your process, or it could mask an actual, lurking problem.
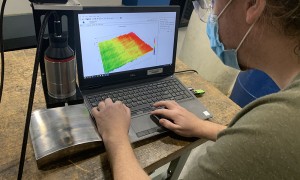
Surface texture analysis in the classroom
The majority of students entering machining and design occupations only received a slight introduction to surface texture analysis. Daniele DeFranceschi, a professor in the School of Engineering at St. Clair College in Windsor, Canada, is working to change that. Tools such as OmniSurf and OmniSurf3D help by making it easy to visualize and explore surfaces.
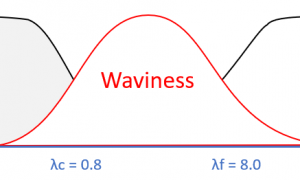
What kind of waviness?
For many industries, waviness is a critical aspect of surface texture. The presence of waviness on a surface can be directly connected to functional problems such as noise, vibration, excessive wear and sealing issues. So, if we are going to control waviness, we need to first understand that there are two different interpretations of waviness
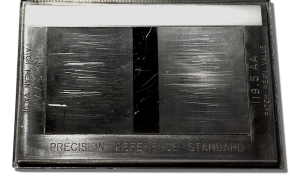
Understanding that scratched-up calibration patch
In many laboratories and production environments, we encounter surface texture calibration patches that look like this. Hopefully yours don’t look quite this bad, but let’s take a deeper look at this damage. Calibration patch surfaces are typically made of electroformed nickel, so they can be relatively soft. As a result, we often assume that the
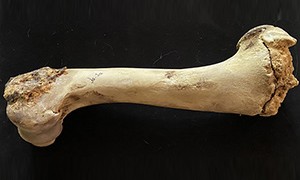
Surface texture analysis for the sciences
If you work in manufacturing you likely think of “surface texture analysis” as a tool for quality control or for improving functionality. But there are many applications beyond the factory walls in which surface analysis can lead to new discoveries or new ways of looking at the world. Carrie Rowe is a doctoral candidate in
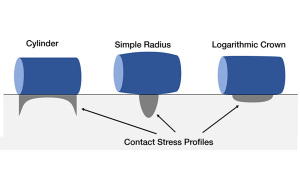
Analyzing crowned profiles with CrownView
In many applications, crowned profile geometries are employed to optimize load carrying and durability. As an example, crowned profiles are used in roller bearings to control local contact stresses. As the image below shows, the shape of the roller bearing surface relates to the stress pattern that develops when the bearing is pressed into its
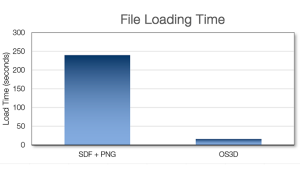
The OmniSurf3D data file format
Digital Metrology wants you to be able to access and explore your data as easily as possible. After all—it is YOUR DATA. Recently Digital Metrology created the OmniSurf3D data file format (*.os3d) for efficient storage, reading, and writing of surface topography data. This file format is portable across operating systems and can be coded directly
Image overlays in OmniSurf3D
You’ve heard the saying, “a picture is worth a thousand words.” This is very true in the analysis of 3D (areal) surface texture. While parameters with numerical values offer some degree of understanding… a picture can often be more instructive.* The false colors in this 3D surface map (from our OmniSurf3D analysis software) indicate the