The measurement of roundness is often debated.
Many of these debates are centered around the tip radius and filtering used in the measurement. This debate is further complicated by the fact that the typical roundness graph distorts reality.
Here is the same roundness data plotted at varying magnifications…
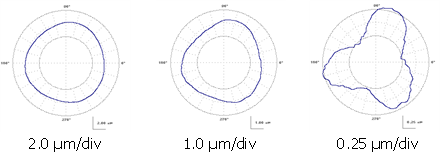
When we look at a roundness graph for an outside diameter measurement we see locally concave areas. Often these areas look rather sharp. This is due to the polar plot scaling and the magnification of “errors” rather than the magnification of the “size” .
The rightmost plot appears as though there are large concave areas on this component. However, this data is from a precision gage ball. The actual workpiece has no concave areas as the polar plot seems to indicate. In fact the actual surface is completely convex and, given the magnitude of the roundness errors, a flat follower would have no problem measuring the roundness of this surface.
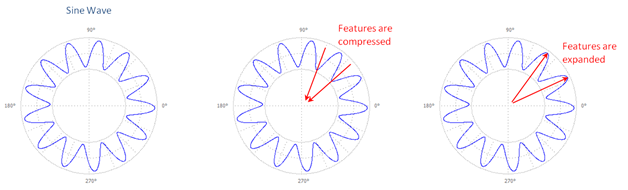
One other problem arises from a polar plot and it’s “vanishing point” at the center of the plot. Since negative values all approach the center of the plot, they tend to “compress”. Positive values tend to “fan out”. This gives the perception that inward features are much sharper than outward features:
When we increase the scale, we see a large (apparent) difference between peak and valley curvatures:
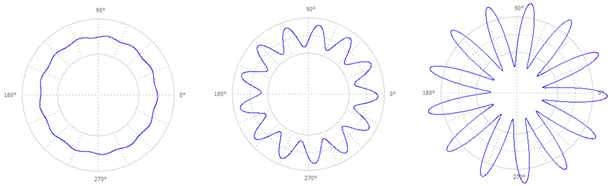
On the right most graph (above) we get the perception that the valley bottom becomes a sharp point. However, this is not the case with the actual data.
So let’s look at sine waves and think about the concept of “radius of curvature”…
Linear sine waves and their radii
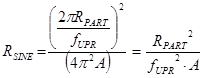
The radius of curvature of a sine wave (either peak or valley) is given by:
![]()
Where,
RSINE the smallest radius of the sine wave (for example at the valley). See Figure A4.
l the wavelength of the sine wave
A the amplitude of the sine wave
Since we are dealing with circular parts, the wavelength, l, is based on:
![]()
Where,
RPART the radius of the part being measured
fUPR the frequency of interest expressed in undulations per revolution (UPR)
which ultimately gives the sine wave radius on a circular part as:
What about inside and outside diameters?
I’m glad you asked.
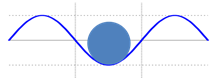
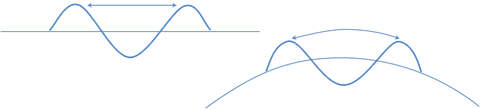
If we are measuring an outside diameter, we can use a larger tip radius to see all of the features of a given sine wave. If we are measuring an inside diameter we will need a smaller radius in order to see the same features: This figure shows a sine wave wrapped around a circle. In doing so, the spacing between the peaks of the sine wave are effectively “widened” as compared to a sine wave on a straight reference line:
Ideally, we would like to combine the radius of curvature of the part with the radius of curvature of the sine wave. Unfortunately, radius values do not mathematically combine, but curvature values do combine. Mathematically, curvature is the inverse of the radius of curvature:
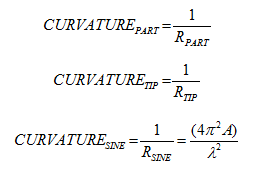
For an outside diameter, the largest allowable tip has a curvature of:
![]()
For an inside diameter, the curvatures add:
![]()
Thus for an Outside Diameter:
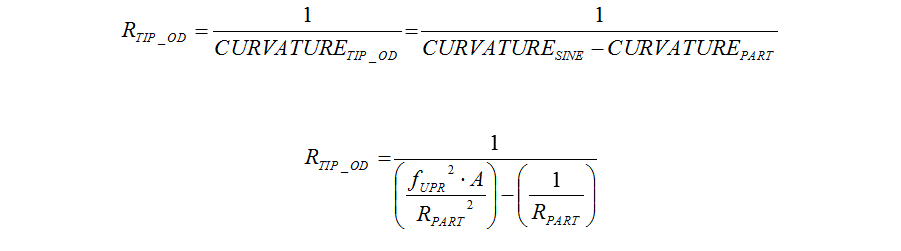
Outside diameter considerations:
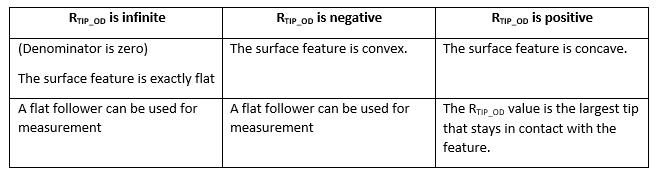
Similarly, for an Inside Diameter:
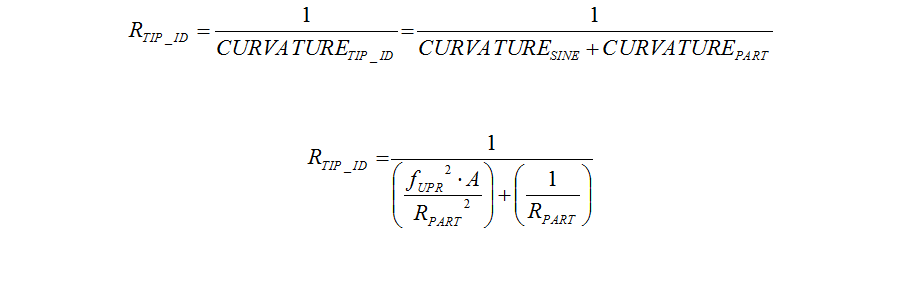
Where:
A the amplitude of the sine wave
RPART the radius of the part being measured
fUPR the frequency of interest expressed in undulations per revolution (UPR)
But what about the filter?
The above defined tip radius will actually touch the bottom of the sine wave, however it will only occur at a discrete point and will cause a “cusp” or “sharp corner”.
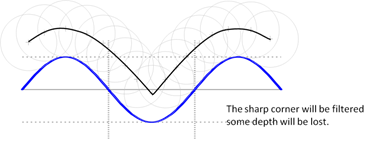
Since the cusp is very sharp, it will be filtered and some of the depth will be lost. Thus, a smaller tip should be used in order to gain additional confidence. A reduction of 25% may be adequate as a safety margin.
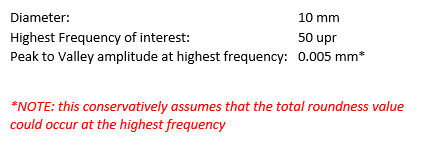
How about an example?
A 10 mm inside diameter has a roundness limit of 0.005 mm with a 50 UPR filter cutoff:
Using the inside diameter equation:
![]()
… and assuming that all of the peak-to-valley roundness error occurs at the highest frequency we have:
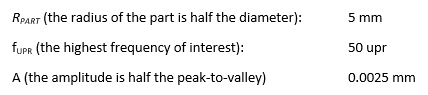
Inserting values:
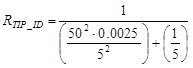
Which gives a max tip radius of:
![]()
A 25% safety factor (multiply by 0.75) gives:
![]()
Conclusion
Roundness may continue to be debated. But this discussion shows that the relationship between surface waveforms and the tip radius can be understood.
For more help understanding your toughest metrology challenges (and help with settling your debates) contact Digital Metrology today!