How much has this surface worn? The answer can be more complicated than it seems…
Accurate wear analysis is critical for designing surfaces in contact. Unfortunately, mistakes are common when it comes to assessing the actual wear depth for an interface. The attributes that we measure and report are often not actually related to the amount of wear.
Macro vs micro wear
Let’s start by considering two types of wear. “Micro” wear occurs at depths similar in scale to that of the overall roughness. It is often due to the ongoing wear typical of a system operating within designed parameters, such as in well-lubricated engine components.
“Macro” wear is typically comprised of a worn region that is deeper than the original surface texture. You will often find macro wear as the result of many tribological tests (e.g., pin-on-disc, ball-on-disc, etc.) in which we attempt to simulate wear at a vastly accelerated pace. This typically results in making a macro wear scar, as the testing conditions are amplified to shorten test times and reduce testing costs.
In many cases, understanding the subtle changes in micro-wear generated within the actual operating parameters is preferable. The good news is that, with modern analysis tools such as OmniSurf and OmniSurf3D, we can analyze both macro and micro wear accurately in order to explore the effects of design options and decisions.
Macro wear analysis
The general rule we will follow is this: once you have wear areas deeper than the surrounding texture, you need to use macro wear analysis. Comparing roughness in virgin material with the roughness at the bottom of a wear scar offers no information as to the depth of the scar. It’s like digging a hole in your yard, then comparing the height of the grass at the top to the size of the rocks at the bottom, in order to estimate the depth of the hole!
For “macro” wear analysis we need to consider the overall volume of material removed (or the area of material removed, in profile measurements).
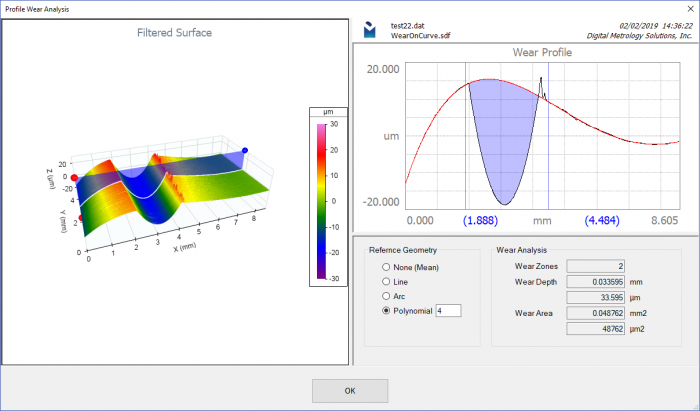
As the OmniSurf3D image below shows, we can fit a reference geometry through the unworn areas to bridge across the worn area. On the right side, we see a red reference line that was created based on a 4th order polynomial. This reference was chosen based on the curved nature of the virgin surface areas, but it could be of any form (line, arc, polynomial, etc.). The wear depth and cross-sectional area are reported based on the shaded, blue region on the right side of the graphic above.
micro wear analysis…parameters can lie!
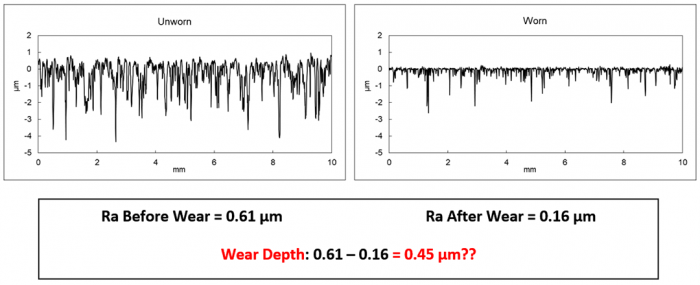
All too often, people will measure a roughness parameter before and after some period of wear, and then use the reduction in the roughness parameter as a measure of the amount of wear. For example, they may simply look at the change in average roughness (Ra) and call that the wear amount.
Consider the two surfaces we showed earlier (and again in Figure 4 below). The unworn surface has an Ra value of 0.61 µm. The worn surface has an Ra value of 0.16 µm. This could lead one to assume that the surface experienced 0.45 µm of wear.
This would be a very wrong assumption!
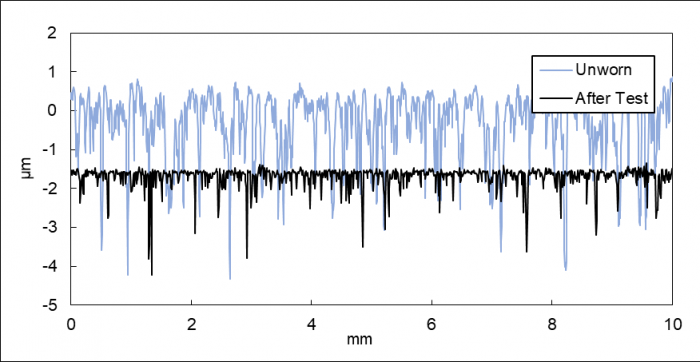
The problem with most traditional parameters like Ra, Rz, Rpm, etc. is that they are based on the surface’s meanline. And, when a surface wears, the meanline moves as well. Thus, there is a new reference line and results are not comparable. If we plot the worn profile on top of the unworn profile, we get the graph below:
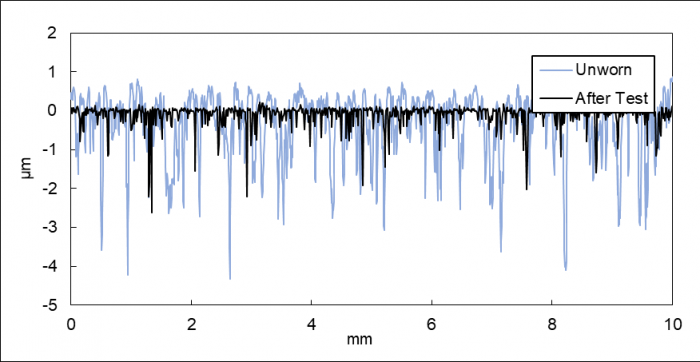
Looking closely at the above figure reveals a problem: the bottoms of the valleys appear to have moved up after testing. In the physical world, the valley bottoms should have remained the same while the peaks moved downward. The wear of the surface should look more like the figure below:
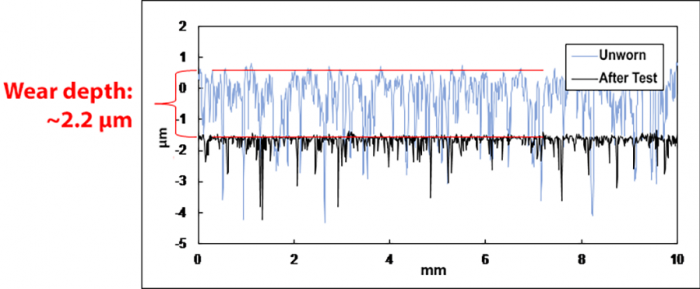
Here we have adjusted the unworn and worn profiles to match up the nominal valley structures. In doing, so we have a very powerful graphic. We can clearly see the worn surface has peaks sitting much lower than the original peaks. In fact, we could look at these superimposed profiles and get an estimate of the wear depth of 2.2 µm—very different than the (wrongly) estimated value based on the 0.45 µm change in Ra!
Read More About Wear Analysis
There is a lot more to tell about analyzing wear. You can read our entire “Advanced Wear Analysis” paper. In it we continue the discussion with topics including:
- Beware of the Rk parameter family—they can lead you to erroneous conclusions.
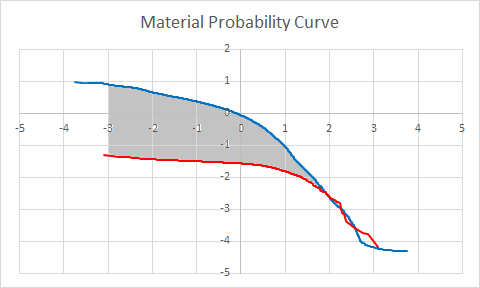
- The “Material Probability Curve” — a classic technique now available in software for more robust and reliable assessment of wear depth.
- How to easily generate the material probability curve in both OmniSurf and OmniSurf3D software.
- Possible measures of wear based on these curves.
Read the full paper here.