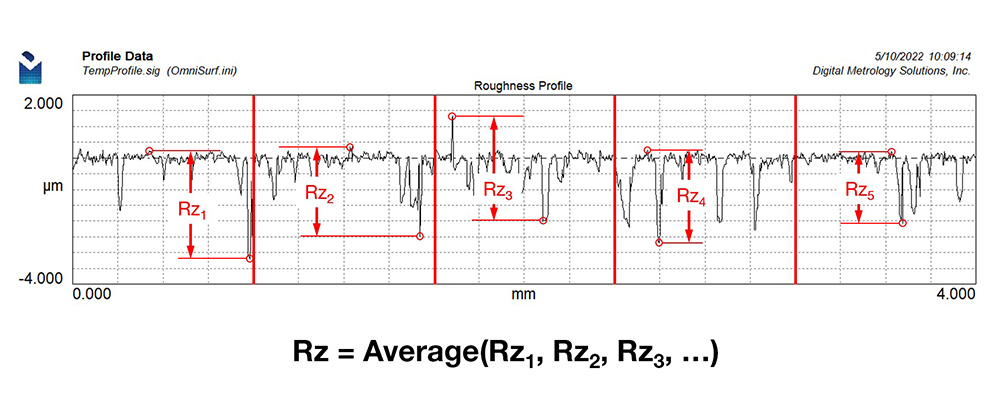
Some 2D (profile) parameters are closely related to their 3D (areal) equivalents. For example, Ra and Sa (2D and 3D average roughness), and Rq and Sq (2D and 3D root mean square roughness) are calculated in similar manners and often produce similar values.
Rz, another commonly used 2D parameter, however, does not generally correlate with 3D (areal) Sz.
The 2D (profile) Rz value is calculated by measuring the peak-to-valley height for each of the sampling lengths, then averaging them together. Averaging provides a stable result, reducing the contribution of any single high peak or low valley across the trace.

Sz, however, is the total, peak-to-valley height of the entire dataset. That is, Sz the difference between the single, highest measured peak, and the single, lowest measured valley. Imagine measuring millions of points…and then basing a parameter on only 2 of them! That’s Sz.

Worse yet, the two points that are used to calculate Sz are likely the two least stable points in the data, most often attributable to noise or errant data.
As an example of how dramatic the difference can be, let’s compare a 2D trace and a 3D areal measurement of the dataset shown above. Ra and Sa provide very similar results. Rz and Sz, on the other hand, differ greatly, with Sz measuring more than twice as large as Rz!

The reality is that Sz in the 3D (areal) world is the same calculation as “Rt” in the 2D (profile) world. This can be very confusing, especially if you are transitioning from 2D to 3D measurement and have come to expect that most parameters will be calculated similarly, just using more data.
Want to know more about surface roughness parameters such as Rz? Check out The Surface Texture Answer Book, by Carl Musolff and Digital Metrology’s Mark Malburg. It covers many aspects of Rz, including why your results may vary from your suppliers’, the difference between Rz definitions (DIN and JIS), the effect of surface pores on Rz, and many other helpful topics.
