A version of this article appeared in the November 2019 edition of Flow Control Magazine.
Surface shape and texture are critically important to a component’s functionality—particularly in sealing applications. Plenty of instruments can measure surface texture, and software allows us to analyze and quantify hundreds of aspects of the data. Yet, despite all that we can learn from surface texture measurements, most engineers continue to specify only basic height-based parameters such as average roughness or total flatness.
The challenge, however, is that “sealing,” like so many surface functionalities, is not measurable purely in units of height. Local curvatures and the “connectedness” of surface features can provide much more valuable insight.
Morphological filters, which have been introduced in surface texture standards and literature in recent years, provide a powerful means to simulate surfaces in contact. These filters are very well suited to predicting how a relatively soft surface (e.g., a gasket or seal) will interact with a relatively rigid surface.
Can you spot a “good” sealing surface using Ra?
As we said earlier, the most common surface texture parameters that are specified in sealing applications are based on heights measured along a profile. These include average roughness (Ra), average peak-to-valley height (Rz) and, in some cases, a waviness height (Wt). It’s not surprising that engineers specify these particular parameters, as they are well known and readily measurable with most surface profilers.
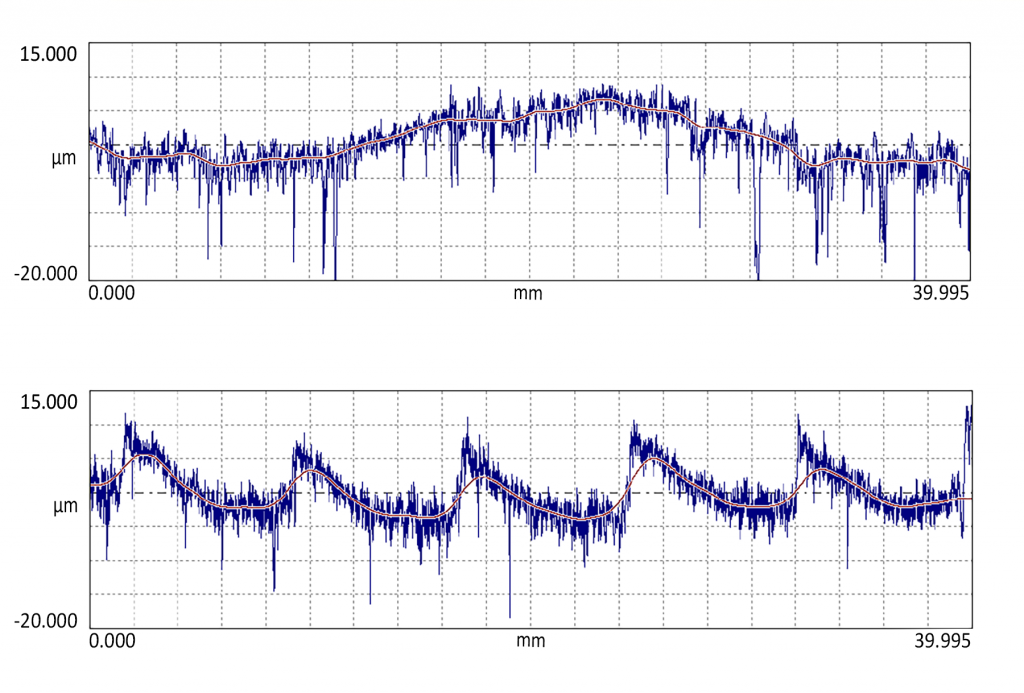
Unfortunately, these parameters don’t necessarily indicate how the surface will function. The image below shows two very different surfaces with virtually identical Ra, Rz and Wt values. If these parameters were specified on a print, the two surfaces would be indistinguishable, and they would pass similar quality control tests. Yet, none of these parameters would reveal that the repeating milling pattern in the second surface could create leak paths between mating surfaces.
Morphological filters provide insight into how a surface will truly function
In recent years new “functional parameters” have been developed to monitor particular functionalities. Engineers can use these parameters to compare design options during development, then specify the same parameters on prints.
One such analysis is based on morphological filters, which can simulate the shape of mating surfaces. In the image below we see morphological “closing” and “opening” filters applied to a surface. The filter in both cases is the path of a virtual circle of a given radius that is moved along the surface data.
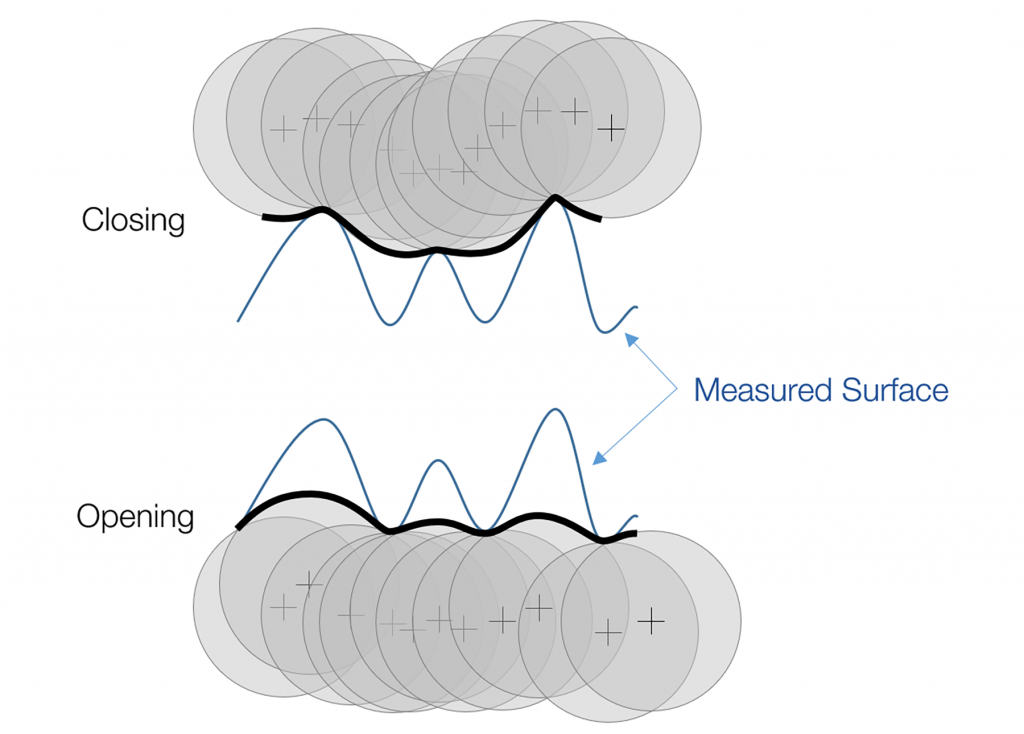
For the closing filter, the filter disk rides along the surface, acting as a “virtual gasket” that follows the peaks and leaves voids in the regions of the valleys. By analyzing the gaps created by the closing filter we can predict potential leakage under an actual gasket.
An “opening filter,” on the other hand, is like a disk pushed up from below the surface. An opening filter highlights sharp peaks in a surface (sharper than the disk’s radius) which may represent oil film penetration points, cosmetic defects, or stress concentrators which could lead to cracking.
For the remainder of this post we will focus on the closing filter and its use in predicting leaks.
A crucial aspect of morphological analysis is that the filters can be adjusted in real time, letting engineers explore how changes in materials, processes and tolerances might improve performance. One may, for example, shrink the radius of the closing filter; the smaller “disk” or “ball” can then enter more valleys, thereby modeling a more compliant gasket material. Or, by raising the cutoff wavelength for the waviness profile we can increase how much the virtual gasket will “crush” peak material.
The path of the closing filter (as shown in black in the figure above) may represent the amount of deformation to be expected by a seal or gasket. However, the difference between the measured surface and closing filter is much more important: it is a direct representation of the cross-sectional leakage area.
Morphological filtering is, in fact, the only surface texture analysis method that can model a sealing interface this directly, making it invaluable for understanding and controlling the root causes of leakage.
How a closing filter can predict leakage
Earlier we showed two surfaces that were indistinguishable by common surface texture parameters. In the figure below, we revisit those surfaces. Their waviness profiles are shown below in red. This time we apply a closing filter, or “virtual gasket” with a radius of 5000mm, shown in black.
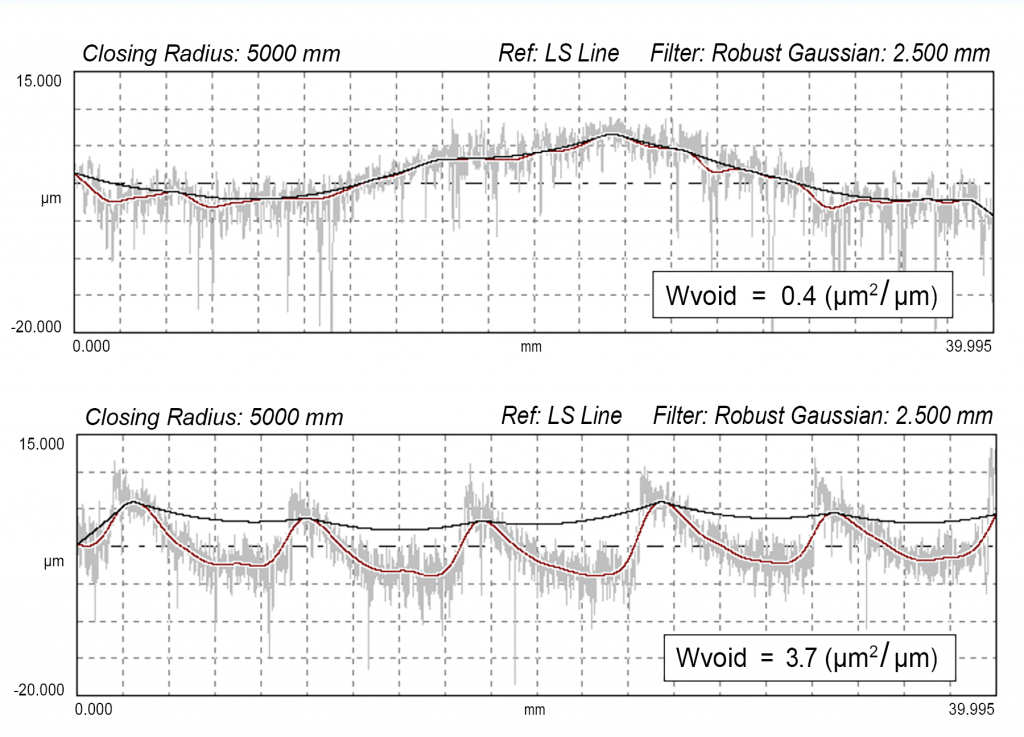
When the closing filter is applied to the first surface we see that it closely follows the waviness profile. Although the waviness is quite large in terms of total height, there are no abrupt changes that would indicate leak areas.
However, when the same closing filter is applied to the second surface, we can readily see large, periodic voids that cannot be sealed by the virtual gasket. These voids are cause for concern.
While the profile graphs clearly show the difference in sealing, we still need a numerical value to indicate the “amount of leakage” in order to specify and control these critical surfaces. To this end, the functional parameter “Wvoid” (void area per unit length) was developed. Wvoid (shown in OmniSurf in the figure above) can be tracked as a measure of sealing quality. The parameter is normalized per unit length, making it independent of the evaluation length and therefore more repeatable and stable.
We can extend this analysis into three dimensions as well. The image below shows how a closing filter is applied to a measured surface using the interactive filtering tools in OmniSurf3D.
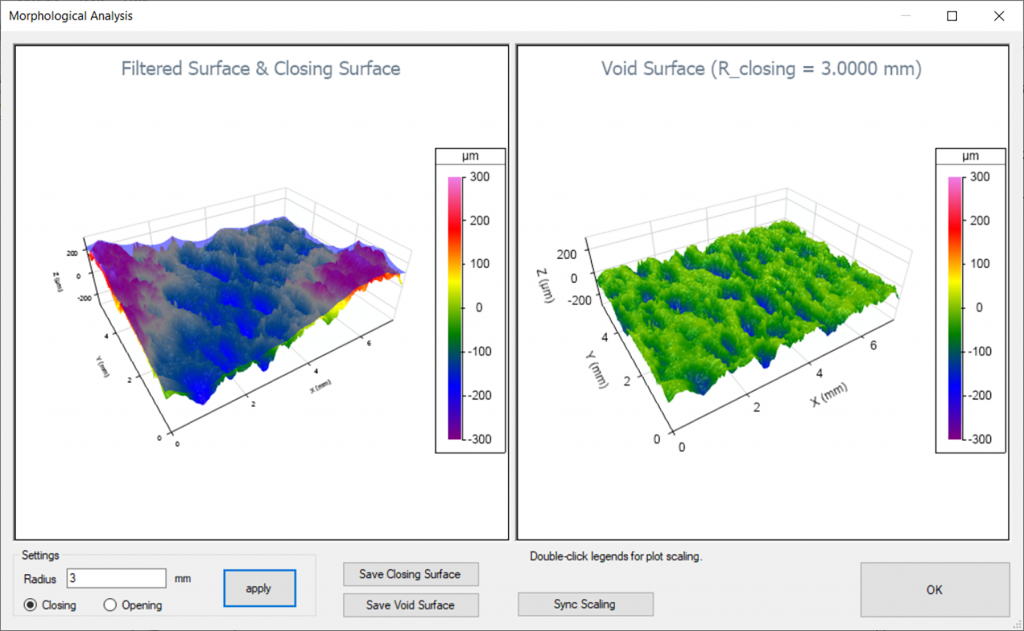
In the above image the closing filter has been applied across the dataset (left) to create the “closing surface,” shown in transparent blue. On the right, the gaps between the closing surface and measured surface is shown as a “void surface,” which represents the void areas where leakage may occur. As with the 2D analysis, changing the radius of the closing filter can be related to changes in conformability and sealing forces.
Using Pit and Porosity Analysis to trace leak paths
Other advanced analyses in OmniSurf3D can help determine which voids in a surface may link up to form leak paths. Below we see the interactive “Pit and Porosity” analysis, which has been applied to a surface to analyze the pores (voids) which may lead to leakage.
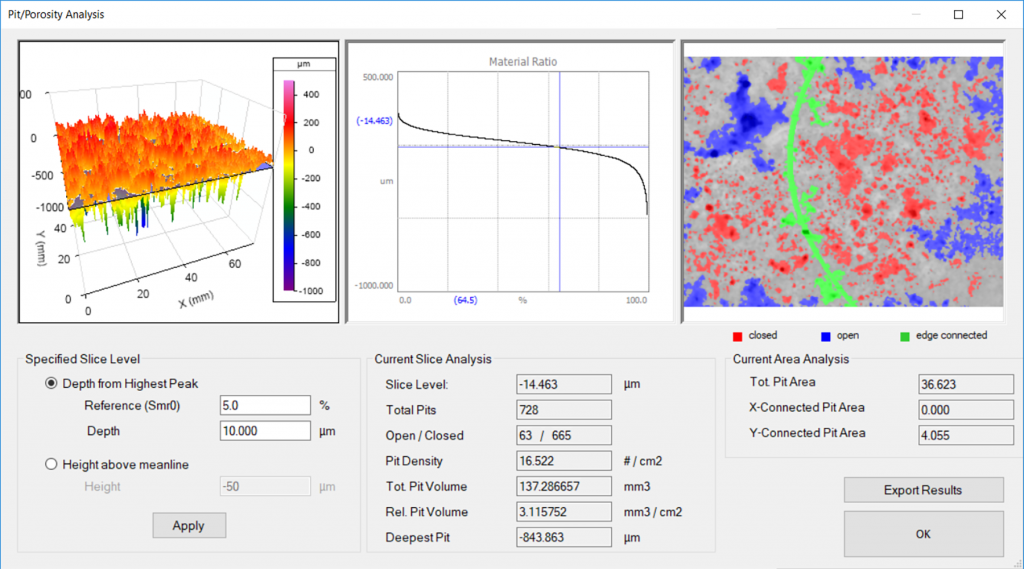
The analysis shows a 3D map of surface heights on the left, the “material ratio curve” in the middle, and a plot of pores and leak paths on the right.
The porosity features shown in red are considered “closed pores,” meaning that they are completely enclosed by material at this given cutting plane. Blue features are “open pores,” meaning they open onto the edge of the data set. The green regions may be the most important. These are “edge-connected” regions, representing potential leak paths which are open along either the X or Y axis of the data set.
At any cross-sectional height level we can count the open and closed pores. Or, we can calculate the “pit density,” the number of pits per square centimeter. Pit density can give a better indication of the surface in general, irrespective of the size of the measurement area. Analysis tools like this make it easy to visualize what is happening as well as providing traceable numbers.
Morphological filters can indicate how well a surface will seal, as well as providing insight about other functionalities. These filters can be used to explore changes to materials and methods that may address the root causes of sealing issues, as well as providing parameters that can be specified on prints to guide production and track surface quality.