Digital Metrology has addressed one of the most common problems in the display of areal/3D surfaces:
The problem of the palette!
In the image above you’ll see the new Smart Palette controls in our OmniSurf3D software being adjusted to emphasize the important features of the surface. How does it work? Let me explain…
Our eyes are very good at distinguishing subtle differences in shapes. Profile graphs are really good at showing us subtle differences in profile shapes. But sometimes certain features (e.g., deep pores or tall spikes) drive the scaling to a point where other features are suppressed or hidden.
Let’s consider this profile:
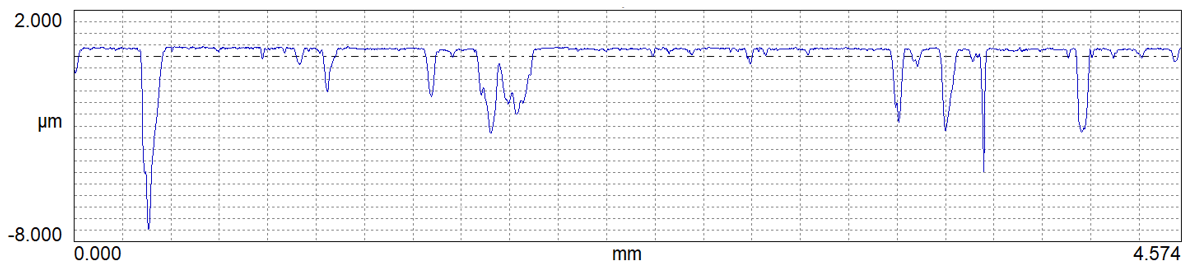
It was made on a very porous surface that has been honed. The porosity is so deep that we can barely distinguish the honed texture on the top at this scale.
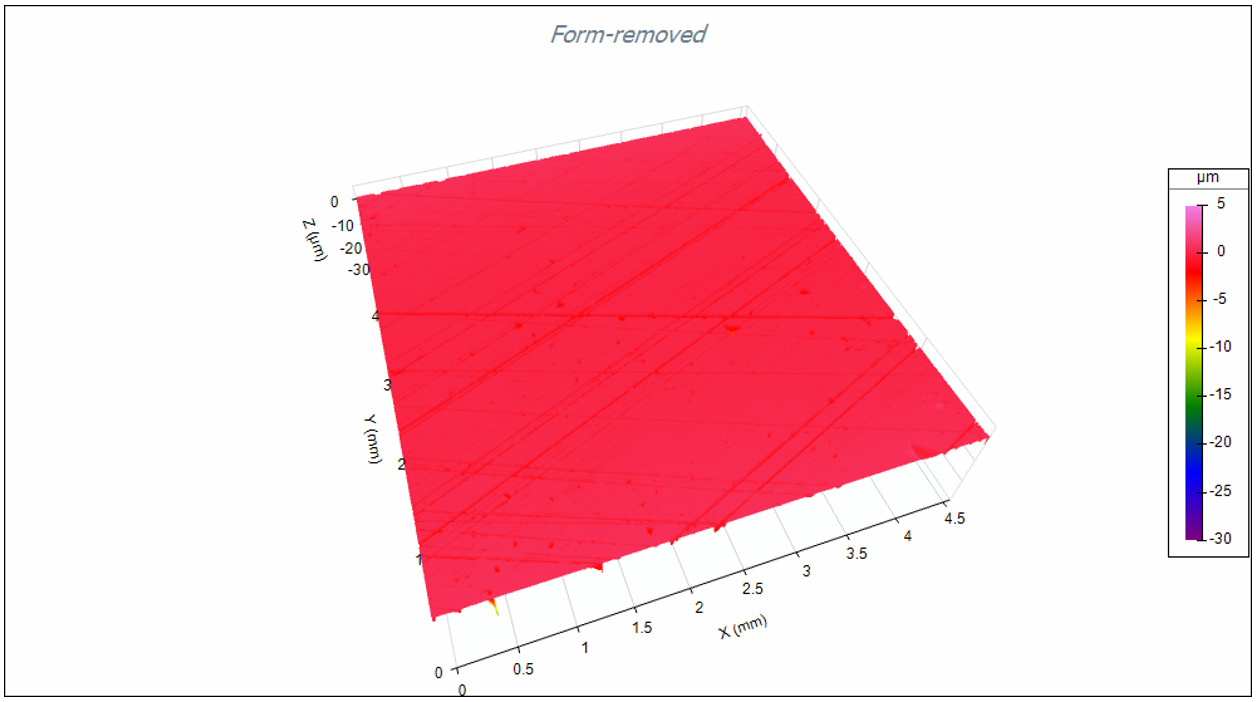
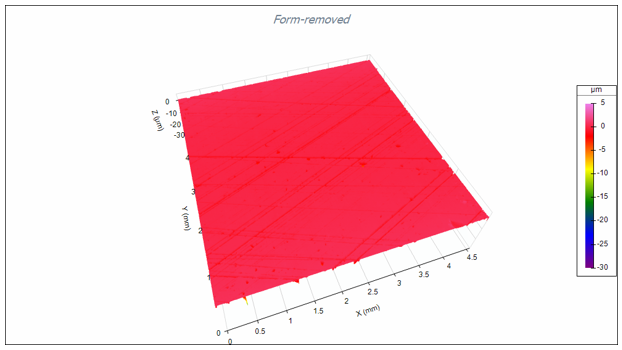
Our ability to see the surface features is even worse with a typical 3D plot:
But at Digital Metrology we want to help you understand your surface, so we are committed to providing tools to make exploration fast and easy. In fact, some customers have even used the term “fun.” So let’s have a bit of fun with this data…
Digital Metrology’s “Omni” software packages (OmniSurf, OmniRound, OmniSurf3D) have a user interface theme running through them: if you would like to change something, double-click it. For example, if you don’t like the plot scaling in one of these packages, simply double click the scale.
So, if we don’t like the coloring of the 3D plot in OmniSurf3D, we can click the color palette bar in the legend. This gives us a powerful visualization tool: the Palette Shifter!
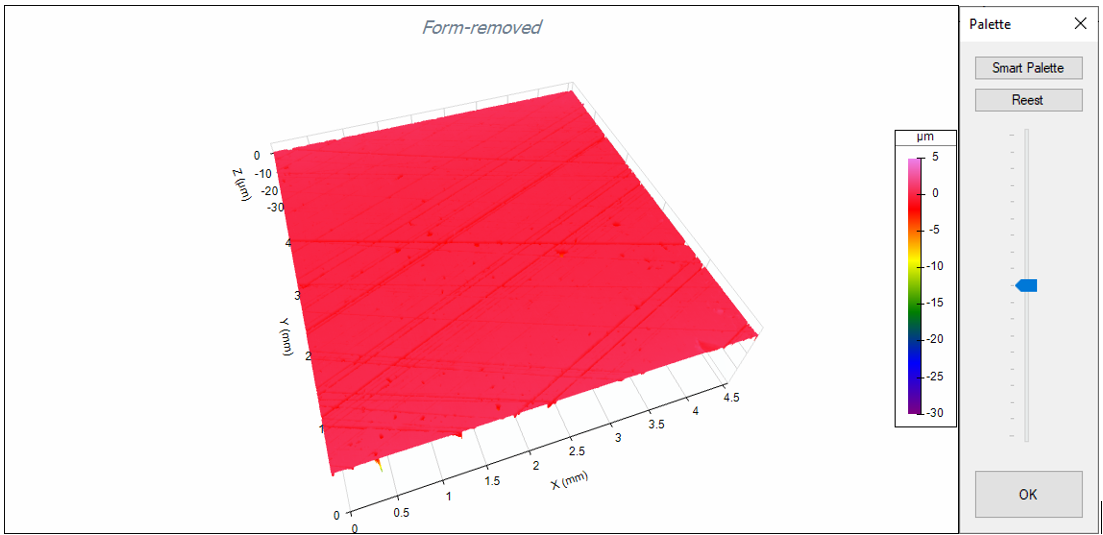
The Palette Shifter allows you to shift the midpoint of the color scale to any position within the height scale. Better yet, click the “Smart Palette” button to automatically optimize the color scaling based on your data.
In the case of the above surface the Smart Palette feature makes this kind of difference!
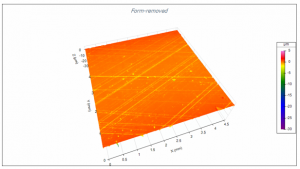
The details of the honed surface are immediately more visible and the plot provides a much clearer representation of the surface.
Note: this is not a change in scaling. We can still see the full heights and depths of the features: we’ve simply (and smartly) changed the coloring to an optimal level.
Let’s have a little fun with the Smart Palette…
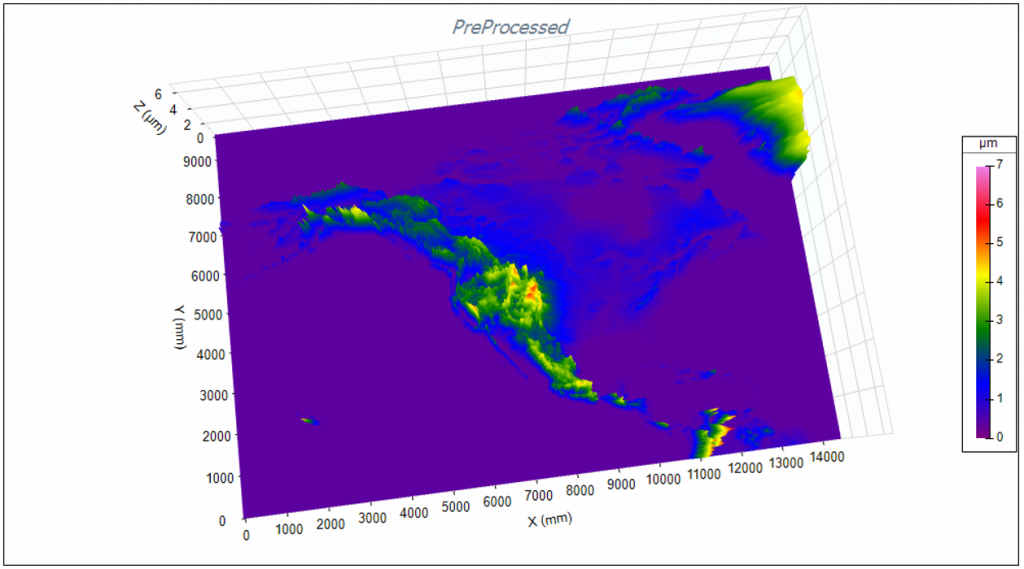
An interesting surface to explore is the surface of the world (contact Digital Metrology if you’d like the dataset for your own explorations). If we open this surface file in OmniSurf3D and zoom in on North America with a standard color palette, this is what we see:
However, with a simple click of the “Smart Palette” button, the world (or at least North America) become much clearer:
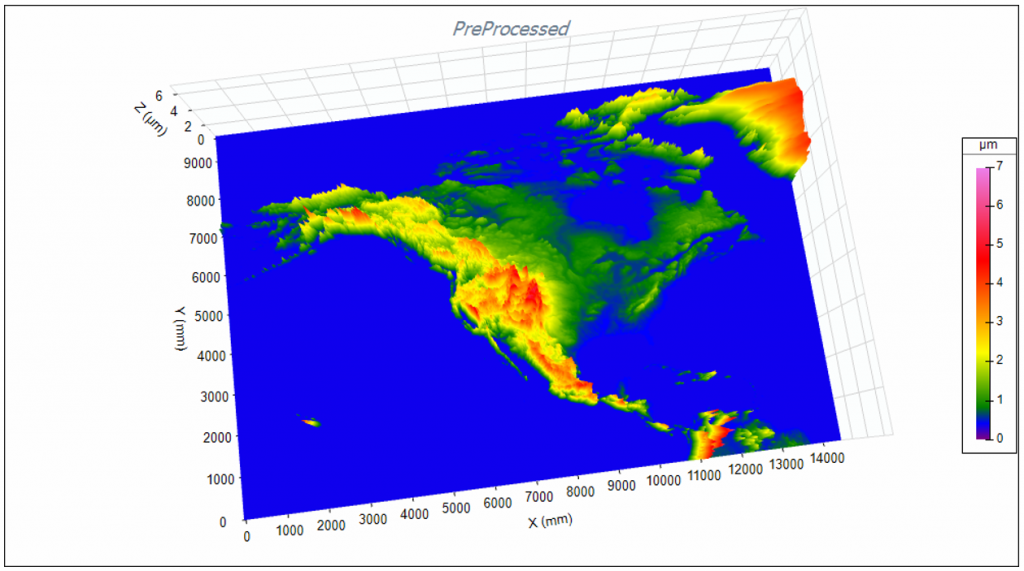
So now the image from the beginning of this post may make a bit more sense. In this animation you’ll see the user adjust the palette slider manually and then will click the Smart Palette button to optimize the palette automatically:
You’ll see helpful features like this throughout the Omni software packages that make it easy to explore data, without overwhelming you with excessive options. Visit the OmniSurf3D, OmniSurf and OmniRound pages on the site to learn more.