For many critical applications, companies are finding it necessary to not just assess the geometric aspects of the surface, but also the quality of the surface. You’ll find specifications with terms such as “torn and folded material,” “porosity,” “pull-outs,” “micro-burrs” and “micro-ledges.”
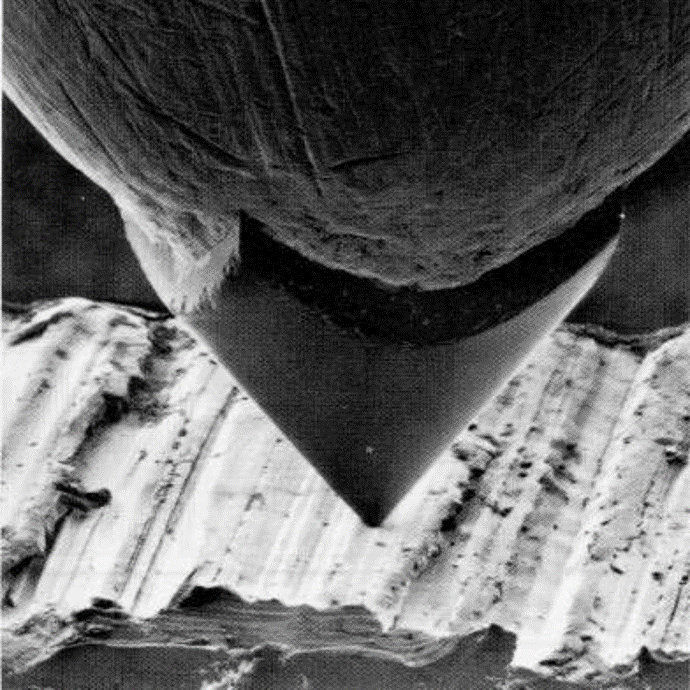
The surface in the image above is marked by torn and folded material with high slopes. (Photo courtesy PTB,Physikalisch-Technische Bundesanstalt.) Such surfaces are referred to as having “poor surface integrity,” meaning they have a proliferation of irregular surface features which are not part of the actual, machined structure. The ISO 8785 specification names some of these imperfections and includes terms like: scratches, cracks, buckles, and burrs.
The difficulty we face is that these surface features are difficult to characterize and quantify. One can employ electron microscopy or micrograph sectioning, but preparation for these techniques is time-consuming and can be destructive. Neither is a proper solution for a manufacturing environment.
A fast, readily accessible method such as stylus profiling would be a logical solution for measuring aspects of surface integrity. Unfortunately, there is a growing concern that a stylus instrument may be incapable of these measurements, or at the very least it is inferior to other methods such as described above. Let’s have a look at that bias, however.
First: Is this a “typical” surface?
When a stylus encounters the steep or folded features of a surface with low integrity, the stylus sides (flanks), rather than the tip radius itself, may come into contact with the surface. When this happens, the trace may provide misleading results. The stylus geometry would prevent accurate measurement, and that would be a fundamental shortcoming. Looking at the photo in Figure 1 you can see how this “flanking” issue may occur.
But here is the important information that’s missing from the photo: typical machining operations do not result in these kinds of steep edges… or at least they shouldn’t. The picture was created by placing a stylus on a very rough, very torn surface. The surface was intentionally made to be very rough so that it would look like a profile graph.
Actual surfaces used on important interfaces do not look like this. Most manufacturing processes produce profile features with flank angles less than 20 degrees. Therefore, for most process measurements, a stylus is a perfectly suitable option.
So a stylus can measure a “good” surfaces…but what about a torn/folded surface?
Processes such as broaching, reaming and burnishing move material in a way that often “smears” material, leaving steep and/or folded features on the surface. A folded area on a surface is said to be “re-entrant” when viewed from above—meaning if you could walk along the surface from left to right, you would need to going back to the left some of the time in order to follow the fold.
SEM Images (especially via secondary detection) can sometimes highlight re-entrant edges, as in Figure 2.
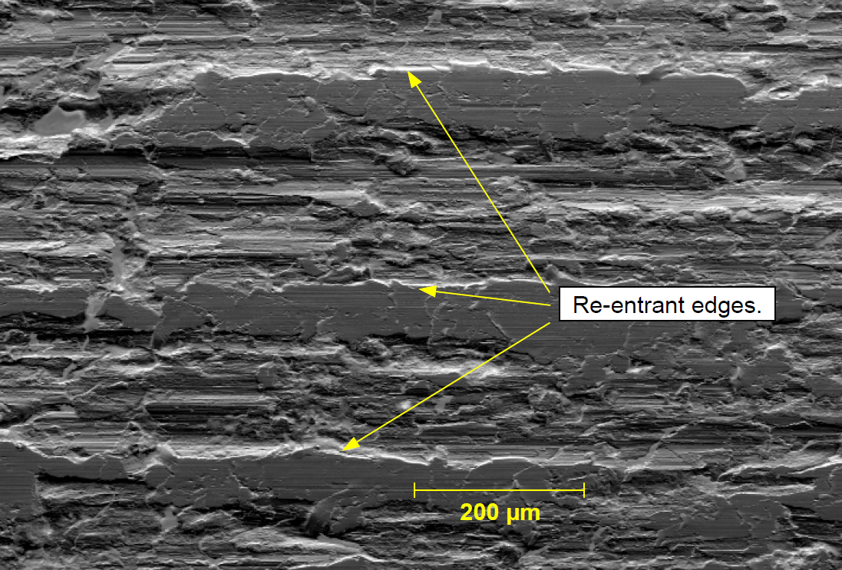
Figure 2. A highly torn surface such as this can occur in processes such as reaming, broaching or burnishing.
A stylus, however, may not be able to directly measure the re-entrant features. Figure 3 shows a side view of a re-entrant feature. A stylus moving left-to-right would follow the green path. It would be unable to clear the overhang of the feature in order to accurately follow the red section of the curve.
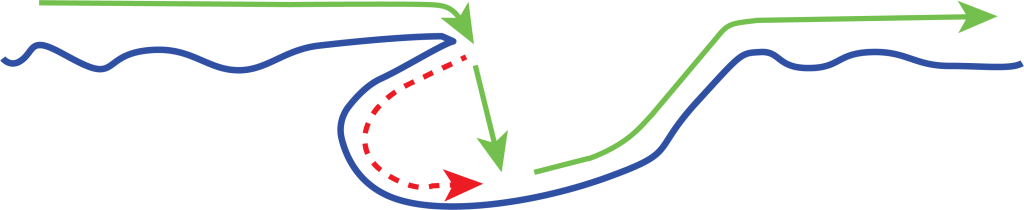
Figure 3. A re-entrant feature. The stylus moves from left to right (green path) but cannot follow the red section of the folded surface.
However, though the stylus may not be able to directly measure the folded surface, with the right tools the profile data can be used to detect steep edges and folds. If we simply look for profile features that are near the stylus flank angle, we can predict the presence of surface integrity problems.
Digital Metrology’s OmniSurf profile analysis software gives us a unique tool for visualizing these effects. For the surface in Figure 2, we would get a roughness profile such as this:
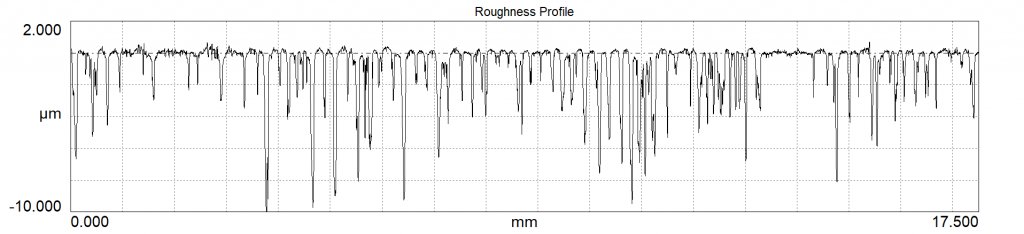
Figure 4. Profile measurement of the surface in Figure 2.
If we activate OmniSurf’s Extreme Roughness Slopes highlighting (set at a 40 degree threshold for a 90 degree stylus having 45 degree flank angles):
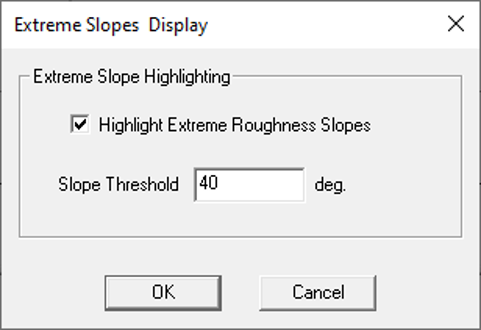
Figure 5. OmniSurf Extreme Roughness Slopes settings.
We get this view of the profile:
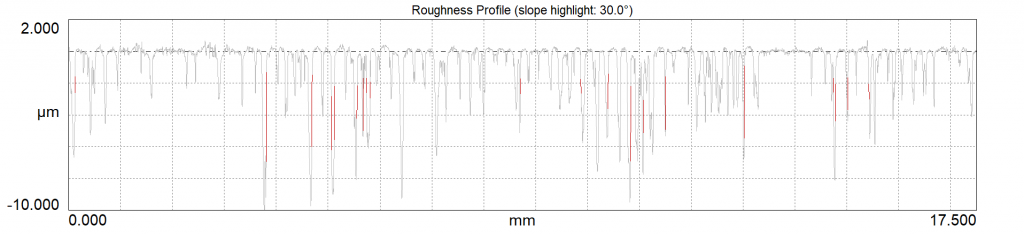
Figure 6. OmniSurf measurement of low integrity surface with extreme slopes highlighted in red.
The red regions highlight areas where the slopes are approaching the stylus flank angles and where possible surface integrity problems exist. Based on this data one could make a decision whether the particular component requires further scrutiny with a different measurement system. More important, one can see at a glance that the process is creating surfaces with poor integrity, and the root cause can be found.
Visualizations and analyses like this make OmniSurf a valuable tool for better understanding your surfaces… and even extending the amount of information that you can get from your stylus-based measuring system.
If you want to read more we have an article on the topic of stylus flanking here:
https://www.sciencedirect.com/science/article/pii/S0301679X96000783
For more information on this, or to discuss your challenging surface measurement applications – contact Digital Metrology today!