
What Do You Mean By “Roundness?”
What frequencies do we include in a roundness measurement?
June 26, 2014
Most of us that have been around surface metrology have had a reasonable grasp of the “filter cutoff” concept. In the case of surface texture there are long wavelengths that we call “waviness” and short wavelengths that we call “roughness”. The wavelength that separates these two regimes is called the “cutoff wavelength” and a filter is used to separate the profiles. (See the 3 Steps to Understanding Surface Texture for more on surface texture filtering.)
A recent addition to Digital Metrology’s OmniRound software gave some interesting insight into Gaussian filtering for roundness. This has been pretty eye-opening for many people and may surprise you. However, some of you many need some background first…
But first some background…
In the case of roundness we don’t necessarily talk about “wavelengths” like we do in surface texture – instead we talk about “frequencies”. Roundness is a low-frequency “form” measurement so high frequency “roughness” effects are removed. Instead of a cutoff wavelength indicating how much high-frequency roughness to remove, we have a cutoff frequency expressed in terms of “undulations per revolution” or “upr”. An “undulation” can be thought of as a “wave”. In fact, in older documents we see the term “cycles per revolution” or “cpr”. In today’s world this term has become upr.
So what frequencies do we include in roundness measurement?
Historically, the default roundness cutoff was 50 upr. This means that anything occurring less than 50 times per revolution is considered to be the “shape” of the surface. If it occurs more than 50 times, then it is considered to be in the roughness regime – not roundness. Recent ISO standards give cutoff recommendations based on the conversion of wavelengths to cutoff frequencies based on the circumference of the part. Ultimately, the designer needs to consider which frequencies are of interest and choose the cutoff accordingly. ISO and national standard propose the “preferred series” of cutoffs to be 5, 15, 50, 150, 500, 1500, etc. This way, the instrument manufacturers and users have a basic set to choose from. Check out a US Quarter at different cutoff frequencies (First row left-to-right: 5, 15, and 50 upr. Second row: 150 and 500 upr):
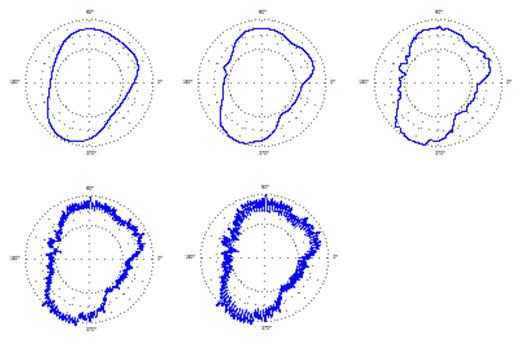
In the case of the quarter, a “default” 50 upr cutoff (rightmost graph on the top row) would not include serrations on the quarter in the roundness evaluation. By the way, if you don’t feel like counting them, there are 119 serrations.
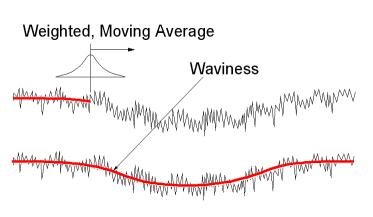
Choosing a smaller cutoff value means that the data will be “smoothed” more. This smoothing occurs via a Gaussian filter which is a weighted moving average and the width of the moving average depends on the cutoff value.
Brick walls and ripples
The Gaussian filter is not a perfect filter in terms of separating frequencies. For example, if you choose a 50 upr filter. It does not mean that you will get everything up to 50 upr and nothing beyond 50 upr. That kind of filter that give 100% of low frequencies and 0% of high frequencies is referred to as a brickwall filter and has this characteristic:
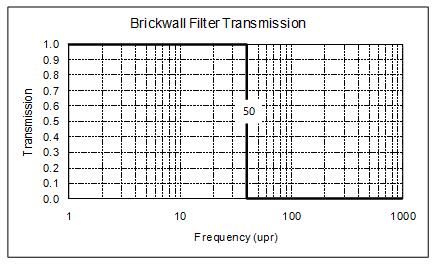
Unfortunately, the brick wall filter causes extra “ripples” to be put into the roundness data. These ripples are due to what’s called the “Gibbs Effect”. (You can Google it for more information.)
To get rid of these extra ripples, we need reduce the transmission at some of the lower frequencies and add some transmission at some of the higher frequencies. When we do this, it makes the transmission less “sharp”. The Gaussian filter is an “ideal filter” in that it has sharpest possible transmission while not adding any additional “ripples” to the profile. For you controls people, you can think of the Gaussian filter as “critically damped”.
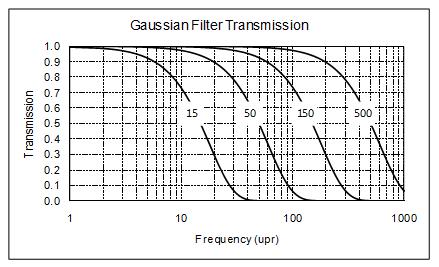
Here’s how the Gaussian transmission characteristics look for some common cutoffs.
Now this may surprise you…
The above transmission graph gives the impression that the Gaussian filter is pretty “sharp” in terms of its transmission. However, that graph is typically shown on a logarithmic x-axis. The latest version of OmniRound allows you to see the selected filter’s transmission right on top of the frequency content of your measured profile.
So let’s take what we’ve seen with the quarter (way at the top) and filter it with a typical 50 upr Gaussian filter (like we’ve just seen) and see what the filter transmission looks like.
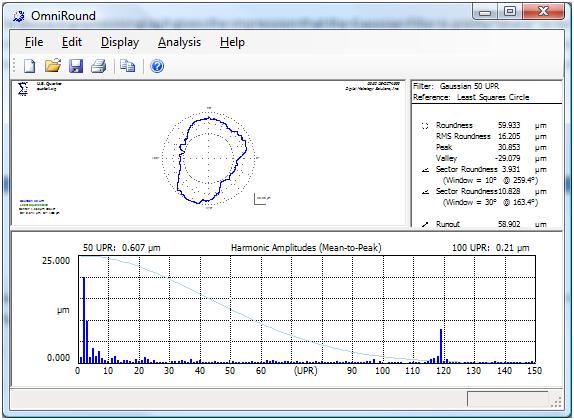
The light blue curve on the “Harmonic Amplitudes” graph is the transmission characteristic for the selected, 50 upr Gaussian filter. This transmission doesn’t look very sharp but it is, in fact, what the Gaussian filter does whenever you are measuring roundness.
(NOTE: If you need a quick tutorial on the harmonic graph and what the bars mean, click over to the BrakeView website and check out the description at: http://www.BrakeView.com/Harmonics.html )
So the Gaussian isn’t a “sharp” as it appears on log paper. In fact as we look at the OmniRound screenshot above, we see that the transmission is very long and it includes frequencies almost all the way to the serrations. If you think that is interesting, check out what a 15-50 upr bandpass Gaussian filter’s transmission looks like:
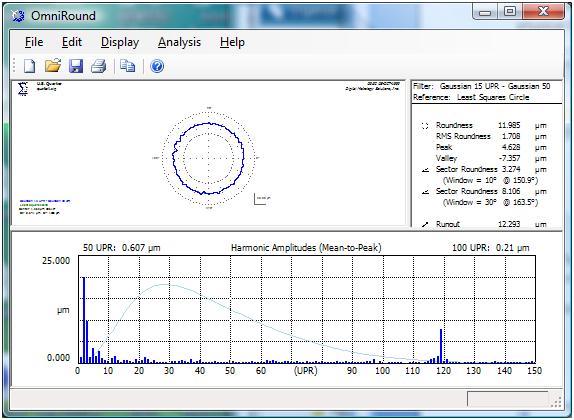
In the case of the 15-50 bandpass, the most that any single frequency is transmitted is approximately only 75%!
So what do we do with this?
I know that this is supposed to be a 60-second tutorial and I know I’ve run way over that time limit. But hopefully this is a quick “reality check” for those of you involved in the specification and measurement of roundness.
There is much more that we can talk about in terms of understanding roundness, harmonics, filter types, bandpass analysis and how these relate to making your parts work better.
Or, contact us for help on roundness specification and measurement.