One of the underlying concepts of OmniSurf3D software is to make everything visual, so that anything you do with the data to produce a number has some kind of image to support it. That’s the way our brains and eyes were designed to interact with surfaces. Our analysis should have a visual basis as well, to make it the most informative.
A great example of this is the Pit and Porosity analysis tool. It’s highly interactive—you can slice through a surface to look at the voids/pores at every level and see the results both as a plane through the data and as results in a table.
We have a great video available here that shows how the OmniSurf3D Pit and Porosity Analysis looks and functions.
The Pit and Porosity analysis is shown below. As you’ll see in the video, as you move the slice level up and down you’ll see the cutting plane moving through the left pane, the corresponding level on the material ratio curve in the middle, and on the right, the features that are being sliced at that particular level.
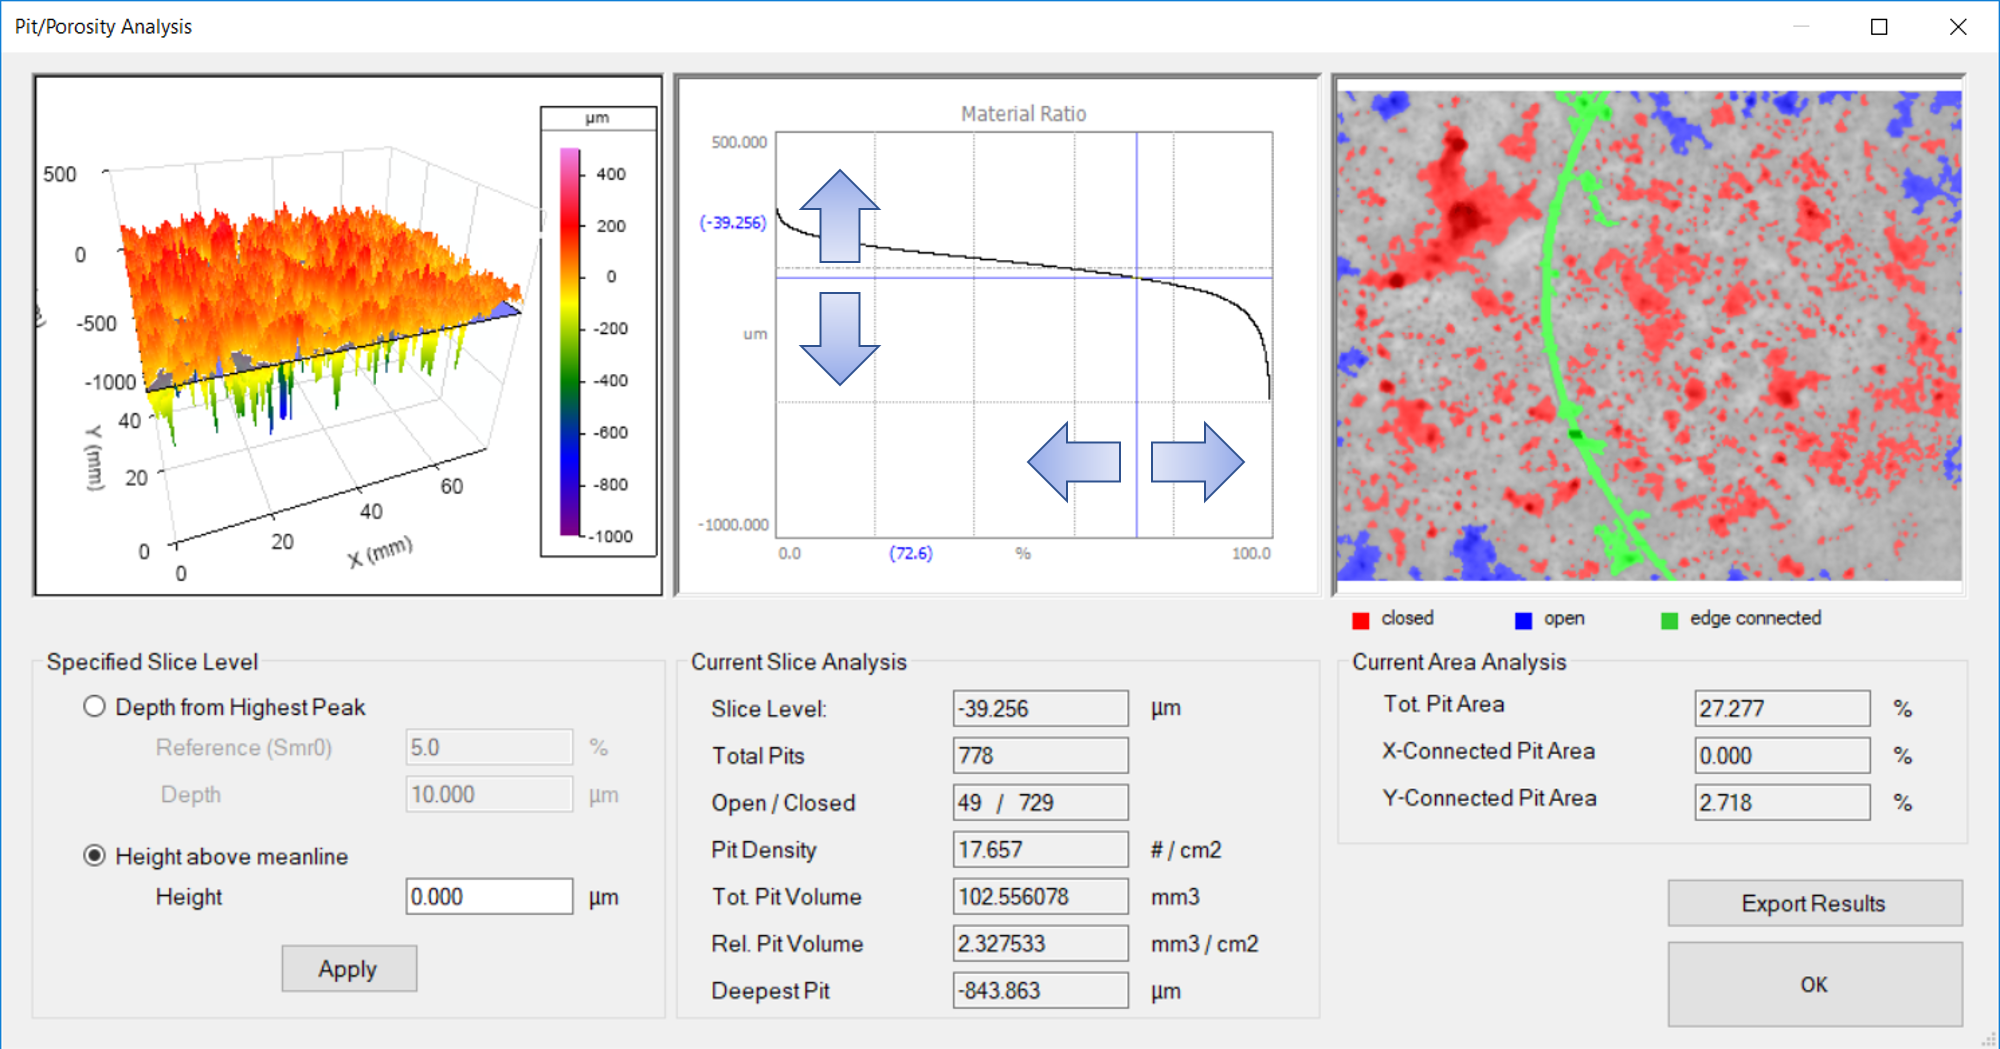
Visualizing closed and open pores
A little more about that plot on the right. The features shown in red are considered “closed pores,” meaning we can see their entire perimeters. Blue features are “open pores,” meaning they open onto the edge of the data set. As you move the slice level upward some of the closed voids become open voids.
If we slide the slice level up even further we reach a point where the open pores actually connect. These “edge-connected” pores are shown in green, and they are potential leak paths. The visual here is quite helpful to highlight the features that link up to form leak paths.
While the visuals can be quite helpful, we also need numbers to support what we are seeing. At any level we can get a count of total pores, and of open and closed pores. Or, we can calculate the “pit density,” the number of pits per square centimeter. Pit density can give a better indication of the surface in general, irrespective of the size of the measurement area.
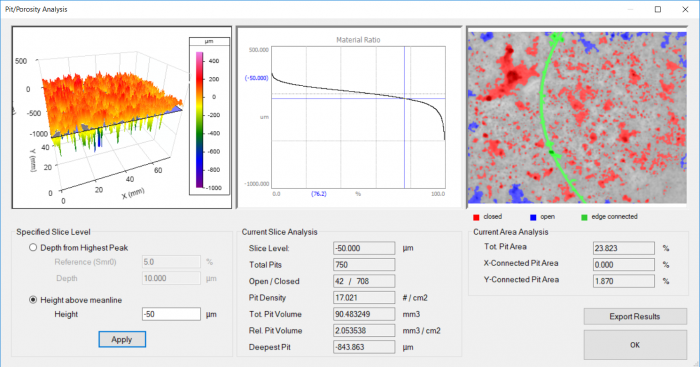
The analysis also gives us tools that let us compare surfaces at some set slice level. We can do this by either manually setting the Height Above Meanline, in the lower left. In the image below, we set it to 50 microns below the meanline.
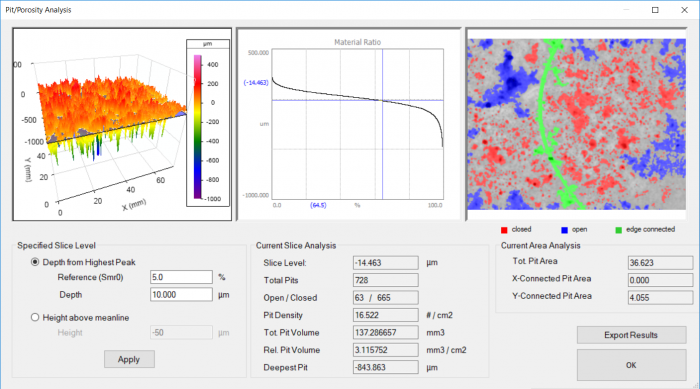
Viewing the material ratio reference
In some cases we may want to use a standard material ratio reference instead. We can enter, say, a 5% reference level (the Smr0 value that we talk about in the ISO standards). In the image below we set the 5% reference level to 0 and then dropped down to about a 150 micron depth.
OmniSurf3D makes things very visual, so we can see in the analysis what we are trying to describe with the numbers. I encourage you to check out the video, and contact us if you have more questions.