For years labs and factories have been attempting to go paperless, eliminating hard copy documents in favor of digital storage. The benefits are compelling, from an environmental perspective as well as for data accessibility.
In many cases, however, “paperless” simply means storing documents as PDF (Adobe Acrobat) files or as bitmap images—exchanging one static format for another. The data in these files is useful from an archival standpoint, but it is no longer an active part of the process.
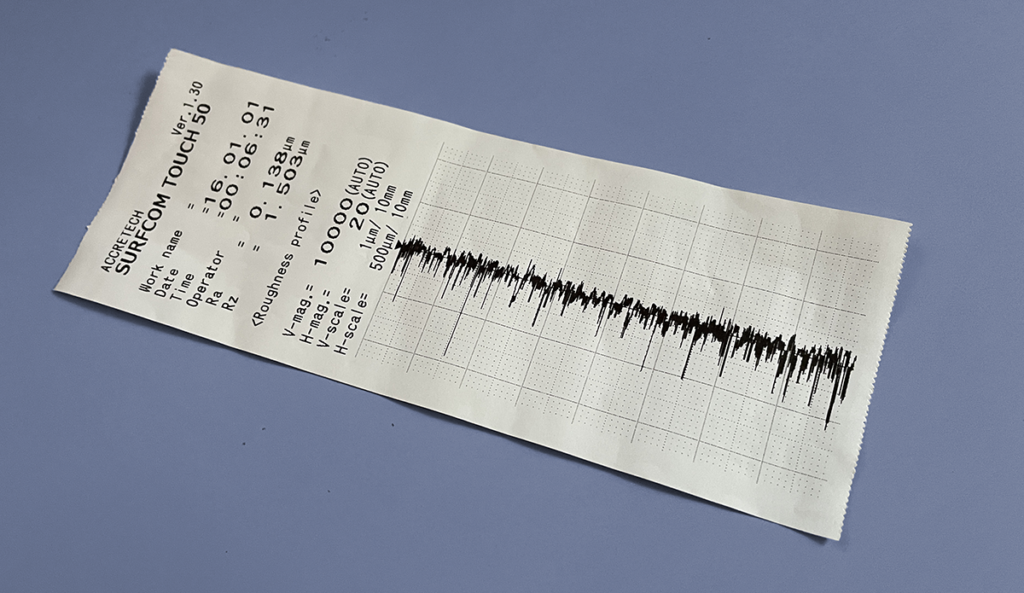
A paper record, like this strip chart, tends to end up in a file cabinet, never to be seen again.
Digital data can remain an active part of an engineering process…when it’s done well.
Further down the paperless path
Supfina (North Kingstown, RI) has taken electronic documentation further. The company manufactures fine grinding and superfinishing machines. “We tend to be measurement intensive,” said Joe O’Hearn, Process Engineering Manager at Supfina. O’Hearn’s team measures customer components at two key points in the development cycle: during initial specification, to verify their machines’ capability in a given application, and again as part of the machine acceptance plan.

Surface measurement equipment at Supfina (image courtesy Supfina)
Supfina made the decision about a decade ago to move from paper to electronic storage in its measurement labs. Printers were removed, and instead measurement data was saved in PDF format using network nodes adjacent to the measurement systems. As inspectors measured parts, they typed the results into spreadsheets and, when a part needed further attention, saved measurement reports in PDF documents.
It was a step in the right direction, but it was also labor-intensive. More importantly, the spreadsheet data could no longer be re-analyzed as part of the process. If any specifications or requirements changed, “We’d need to go back into the lab and run new measurements,” said O’Hearn.
The measurement software itself also presented a roadblock for the digital flow. Most measurement systems are shipped with proprietary software for acquiring data. But the analysis capability of such software can be somewhat limited. “Our users often have very sophisticated roughness callouts,” said O’Hearn. “Those requirements may involve specifications for both roughness and waviness, with varying evaluation lengths. To do that kind of analysis with the instrument’s software would be very tedious.”
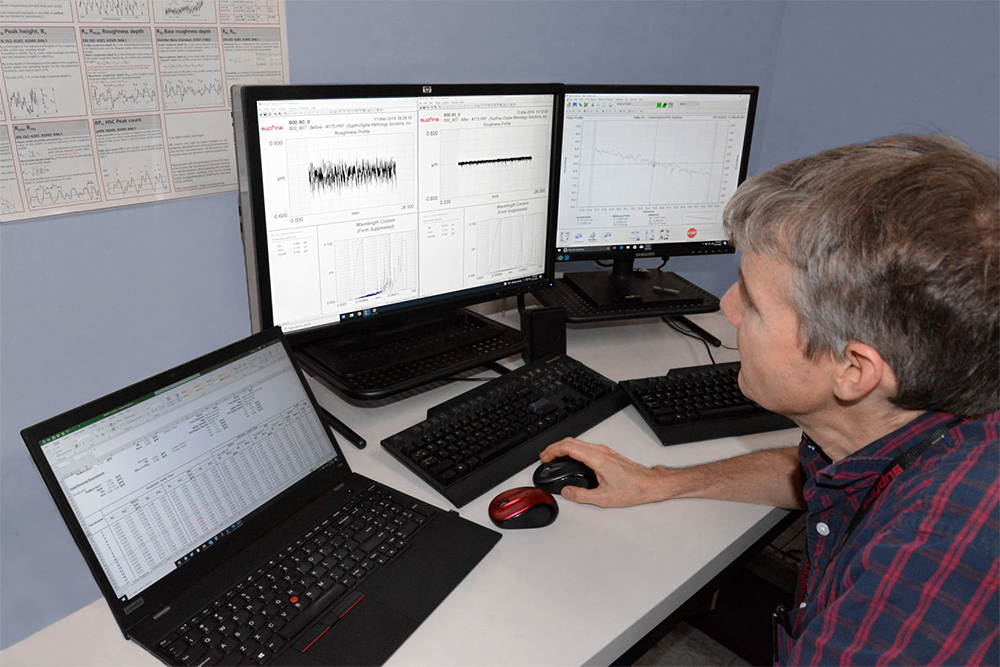
Joe O’Hearn working with OmniSurf (image courtesy Supfina)
Enter OmniSurf
A big step forward came when the team began using OmniSurf surface texture software to analyze data from their measurement instruments. OmniSurf can read files from a wide range of instruments, which allows Supfina to analyze and compare their data with the data collected by their customers—an important part of the process development cycle.
Most importantly: data saved using OmniSurf can be re-analyzed and re-used. When a new machine is being specified, for example, engineers can pull data from prior jobs and reanalyze it in the context of the new requirements. The ability to reuse data without re-measurement saves considerable time in the development cycle. Furthermore, it allows engineers to go back in time and explore the surfaces even when the parts are no longer available.
Another major advantage of OmniSurf is that it enables users to access and analyze data from anywhere with a network connection. This of course frees up the measurement instrument for other tasks, but more importantly, it enables engineers and technicians to access, analyze and share data easily. Viewing the same data with the same settings makes it far easier to understand how a surface develops as it passes through the process.
A third advantage of OmniSurf is its capability for analyzing large numbers of data files quickly—a must for companies that manage data from many thousands of measurements. “Batch processing is one of the most powerful features of OmniSurf,” said O’Hearn. “It’s as easy as any function like that should work.”
Making data visual
With OmniSurf it is possible to compare pre-processed surface data side-by-side with the surface after processing—a powerful way to see the effectiveness of the process. O’Hearn describes a typical example: the fine-finishing of a ground or hard-turned shaft. By showing the incoming shaft surface next to the surface after finishing the company can ensure that they have removed sufficient material to remove lead and other tool marks.
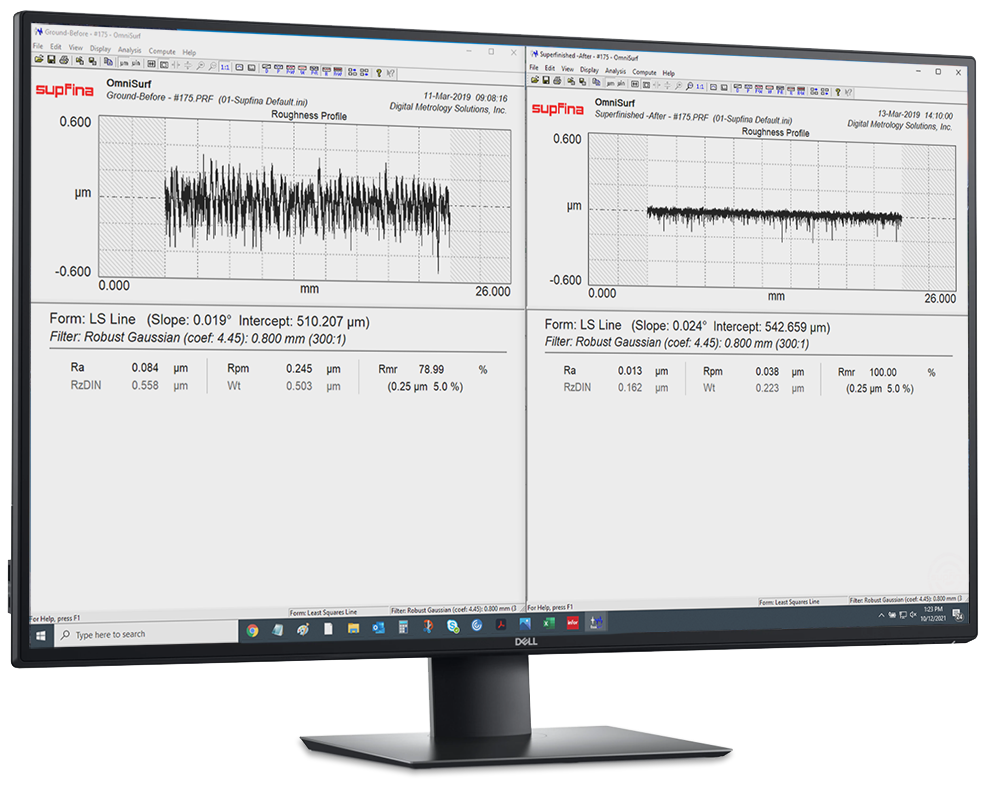
Data before and after superfinishing is displayed side-by-side (Courtesy of Supfina)
The Wavelength Content graph is another feature that, according to O’Hearn, allows their team to see “what might be going on underneath the surface.” If something has changed in the process, the incoming surface, or the material, the Wavelength Content graph can often show these changes more clearly than just observing a series of profiles.
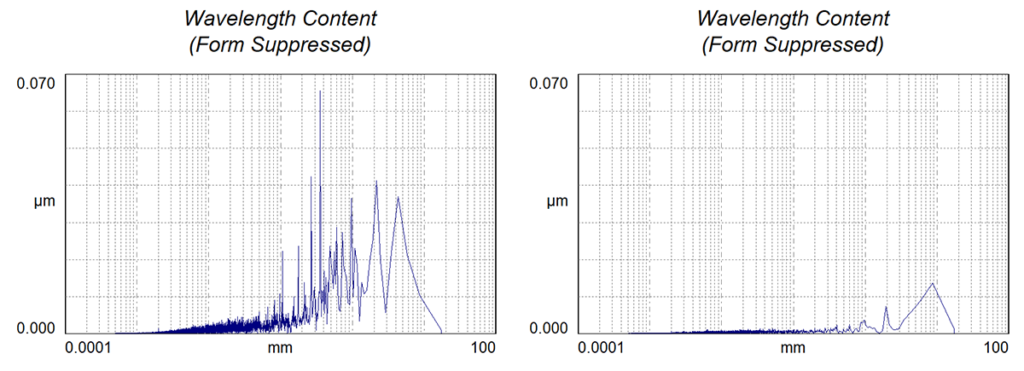
OmniSurf Wavelength Content graph showing a surface before and after superfinishing
Supfina’s world class digital workflow allows for efficient, transparent data sharing, with data that remains “alive” for further analysis as changes in requirements dictate. OmniSurf is an integral part of that flow, with straightforward file handling and analysis that lets engineers, management and technicians share data across the process.