When we look at an areal (3D) measurement of a surface it can appear as a vast landscape of many sizable features: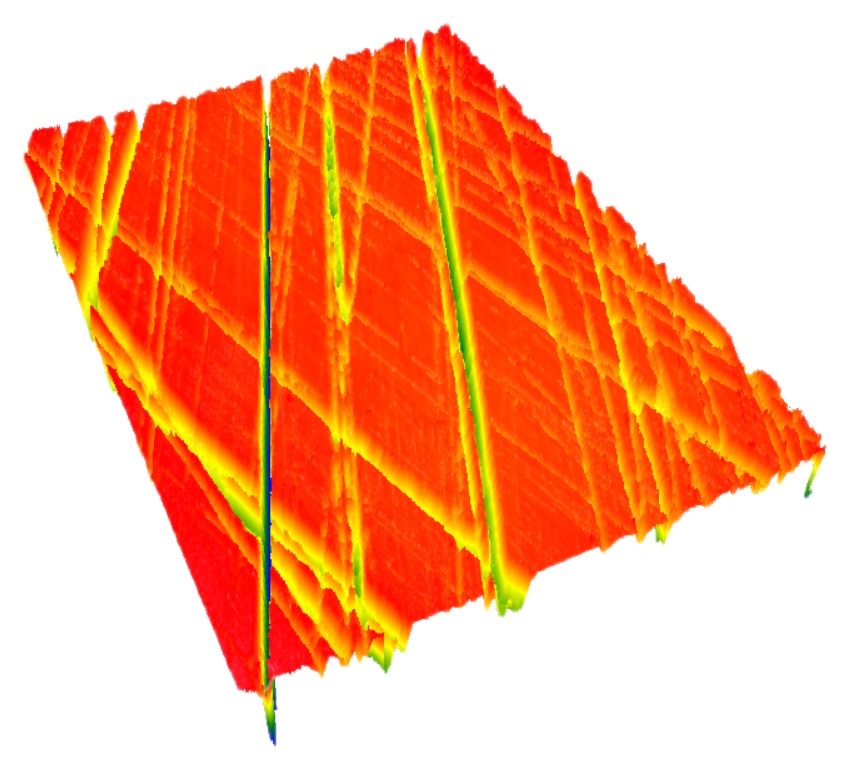
An optical, areal measurement typically includes millions of points. On the other hand, a stylus-based, 2-dimensional measurement typically includes just thousands of points. But just how big are the areas covered by these instruments? Appearances can be misleading… if we don’t look carefully at our graphs.
Putting 2D and 3D measurements to scale
The image below shows a 15 mm stylus trace. This is a common stylus-based measurement length for surfaces such as cylinder bores. With some of today’s instruments, profile lengths can actually be hundreds of millimeters.
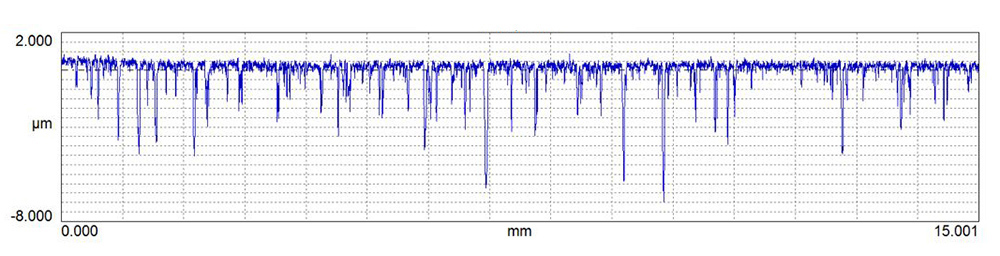
The spacing with a typical stylus instrument is typically 0.5 µm or less. To achieve that same lateral resolution in a 3D system (with a typical 1024×1024 camera) we achieve a field-of-view of roughly 0.5 x 0.5mm. Here is the areal data shown to the same lateral scale as the profile trace:
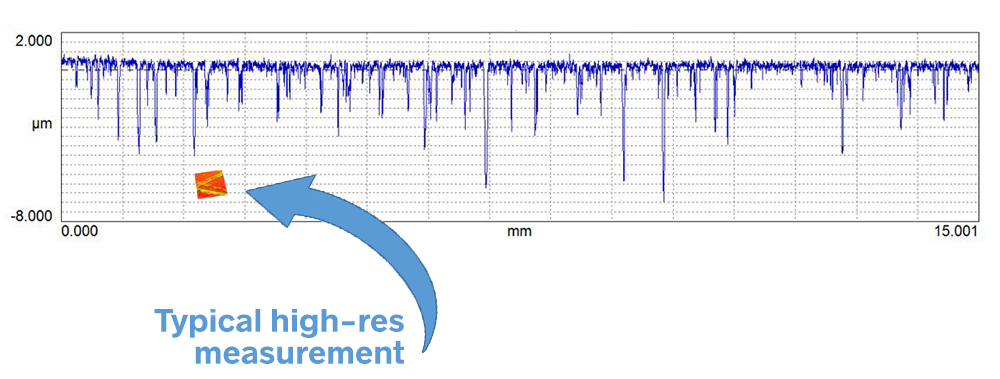
It can be a little jarring to see that all of that high-resolution data covers such a small amount of territory!
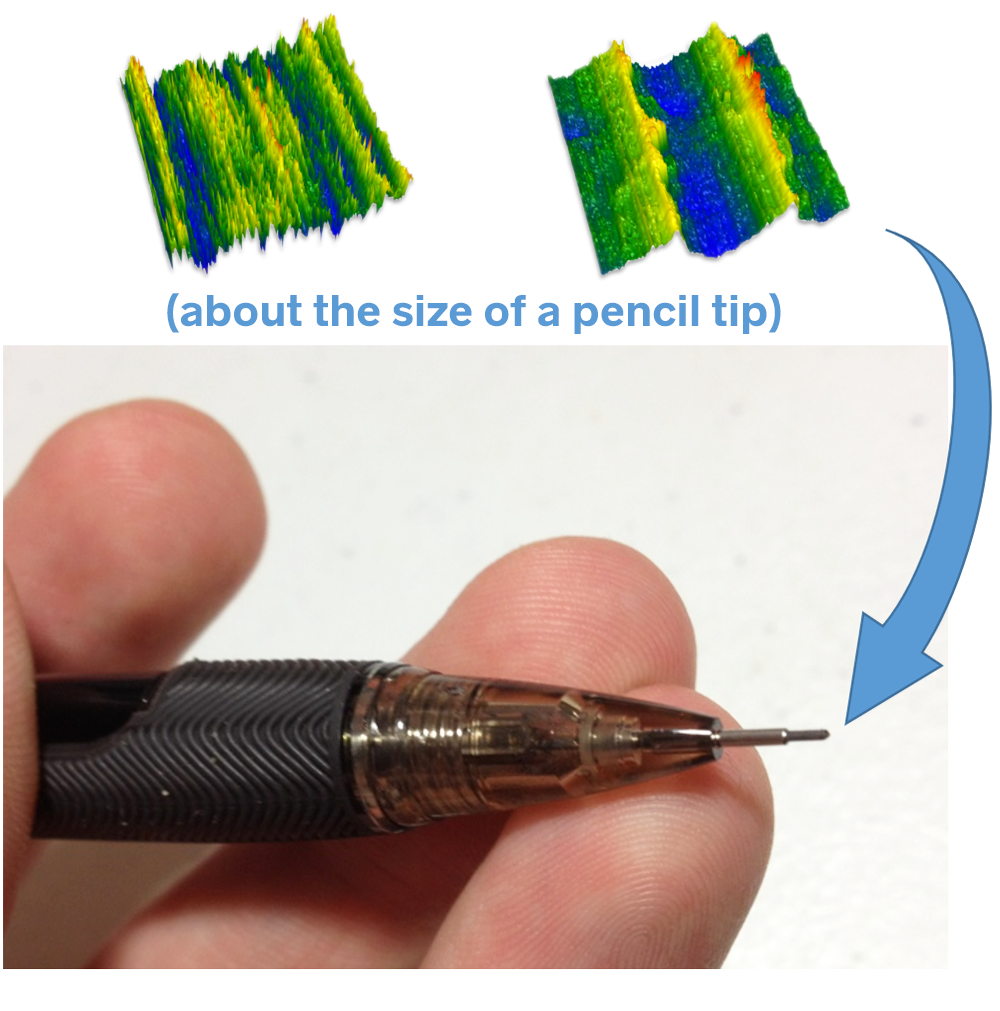
Below is another way to visualize that size. The 0.5 x 0.5 mm (500 x 500 µm) measurements, with all of their complex structure, are each approximately the size of the tip of a fine-point, mechanical pencil:
To get a larger area: stitch measurements, or lose resolution
The primary benefits of 3D measurement are the ability to detect and measure, with high resolution, structures that occur within an area. The tradeoff can be the actual size of the measured area versus the ability to see the fine details.
While measurements may be small, we do have options for acquiring a larger area of the surface. One option is to stitch together multiple, high-resolution images to obtain a single, large area measurement. Another option is switch lenses/objectives to obtain a larger field of view — while sacrificing of lateral resolution.
The image below includes a typical 2 x 2mm low resolution or stitched measurement on the right. The image covers more area than the single field of view…but it’s still only a fraction of the length of the 2D trace. 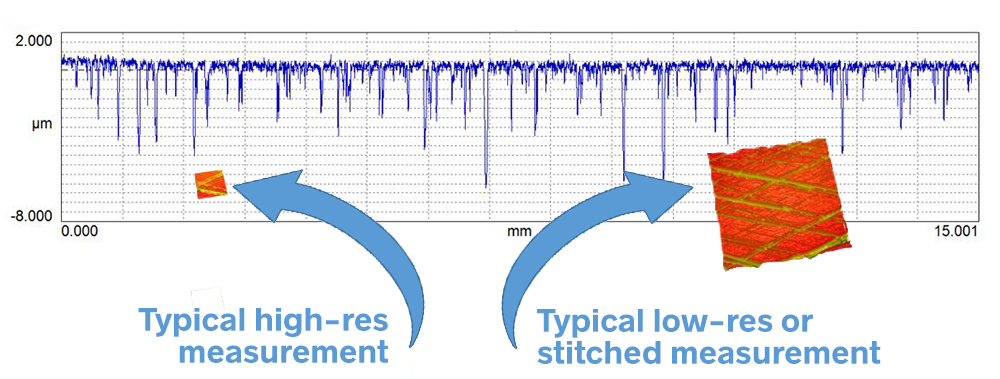
Large area and high resolution are both possible—with tradeoffs
Modern optical instruments make it possible to achieve high resolution, or large area, or even both. We can acquire a single field of view in excess of 10 x 10 mm, but at greatly reduced resolution. We can stitch together hundreds of high-resolution dataset—but acquisition time may run into hours.
The choice of how to acquire the data comes down to a number of important tradeoffs:
The size of the features to be measured
Above all, the features of interest dictate the measurement requirements. With a stylus instrument the evaluation length has to be long enough to encompass the largest wavelengths of interest. For the plateaued surface above, the length should be chosen to obtain a statistical number of characteristic valleys. The same holds true for 3D measurements: we have to measure an area large enough to include the features of interest and to evaluate the wavelengths of interest.
The resolution we really need
Having access to incredibly high resolution can make us a little power-hungry (and high res makes for fantastic looking images). But again, the smallest features, and the smallest wavelengths of interest, dictate how much resolution we actually need. There may be no need to assess nanometer-scale roughness features on a machined part if the micron-level features have the predominant effect on performance.
Measurement time
With modern optical instruments we can stitch together vast numbers of measurements, generating huge, high resolution datasets. Some applications will require this combination of resolution and measurement area. But acquiring that much data is extraordinarily time-consuming. If the area and/or resolution can be reduced, then measurement time will be considerably faster.
Data file size
Those high resolution, large area measurements also impact storage space and analysis time. It’s not just the acquisition time that need to be considered—processing, filtering, rendering, and even saving large datasets can also become excruciating, especially when the clock is ticking on a project deadline.
Ultimately, the goal with areal measurement is to find an efficient way to acquire the needed measurement information, with sufficient resolution and field of view. If the application requires both high resolution and a large measurement area, then you may have to buckle in for a long measurement run. However, if you can choose either high resolution or a large area, then you can take advantage of an optical instrument’s fast acquisition speed—and keep the size of the data file small enough for fast processing and analysis.