We’ve all seen a chart like the one below, showing that very different surfaces can have the same average roughness (Ra) values:
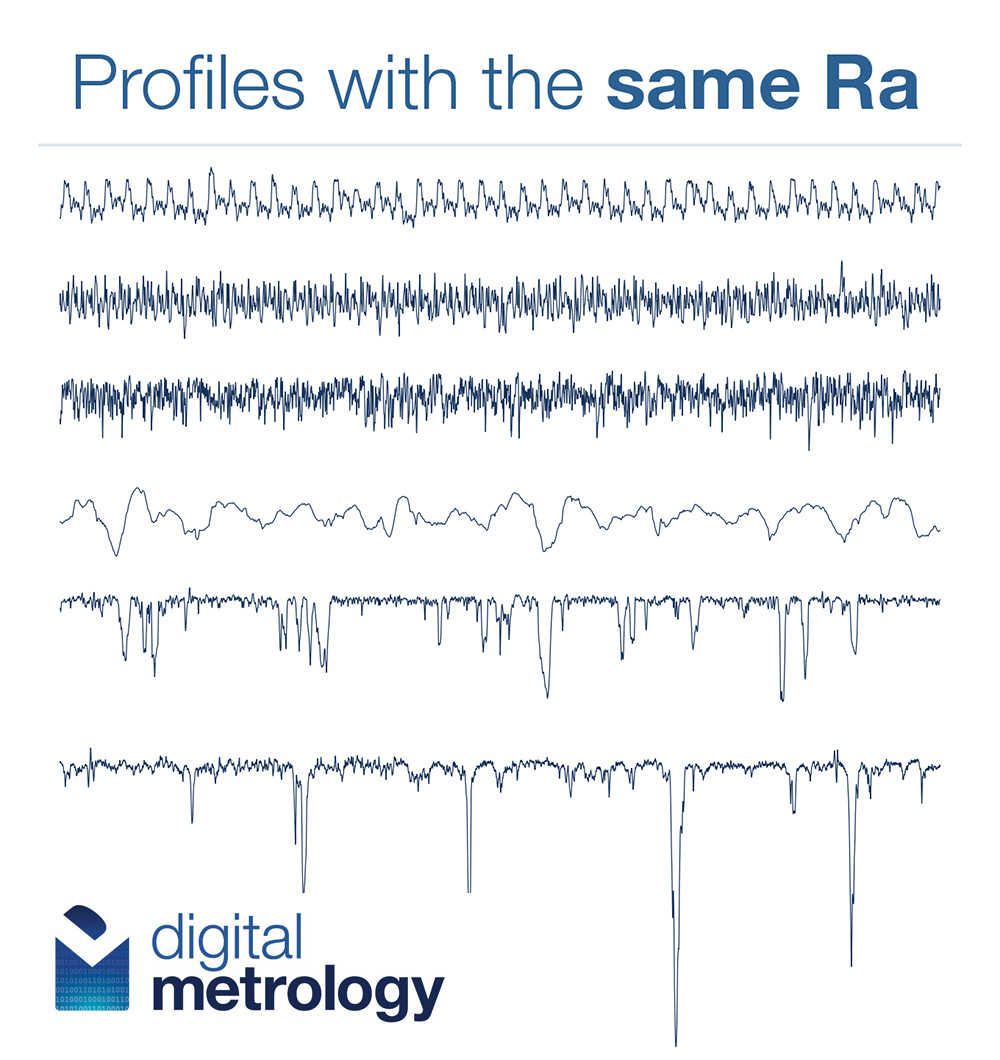
An Ra reading from your gage can’t tell you which of those surfaces you made!
So, does that mean that Ra is “bad” and that other parameters may be better? Let’s have a look.
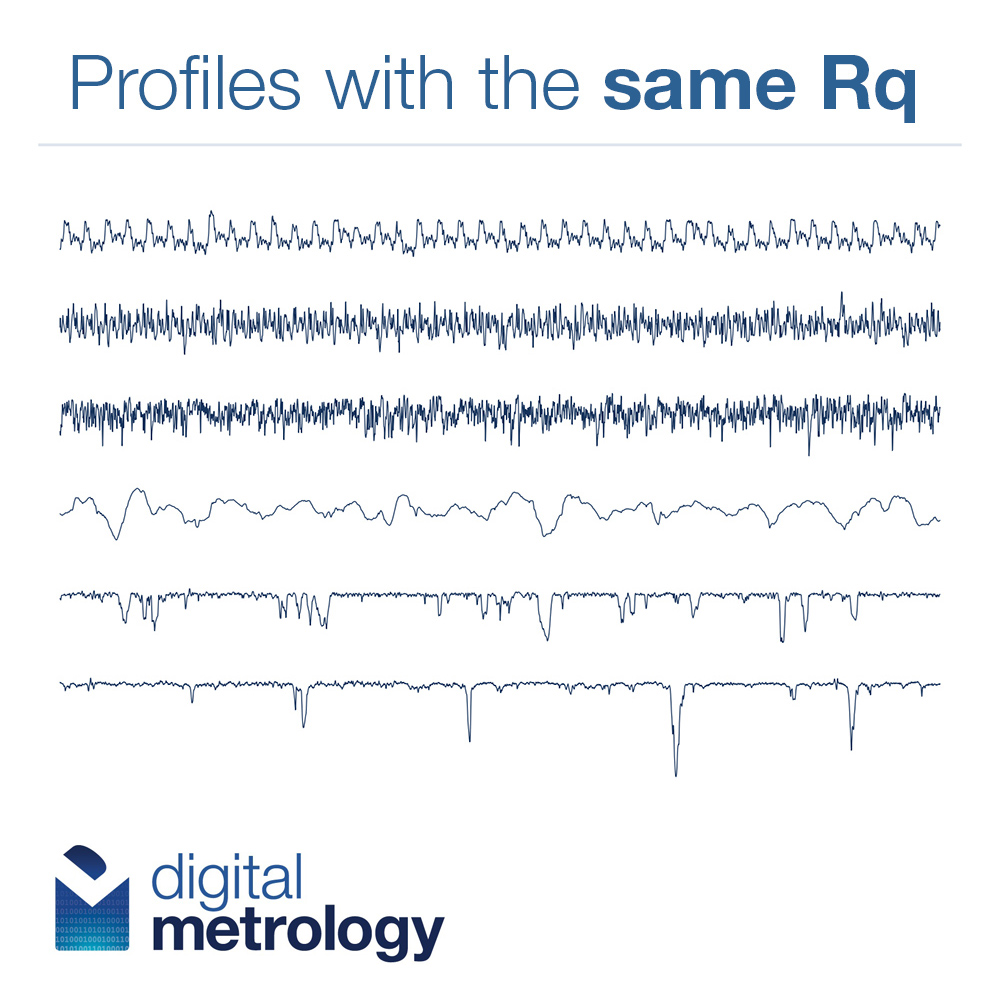
The surfaces below all have the same Rq (RMS roughness) value:
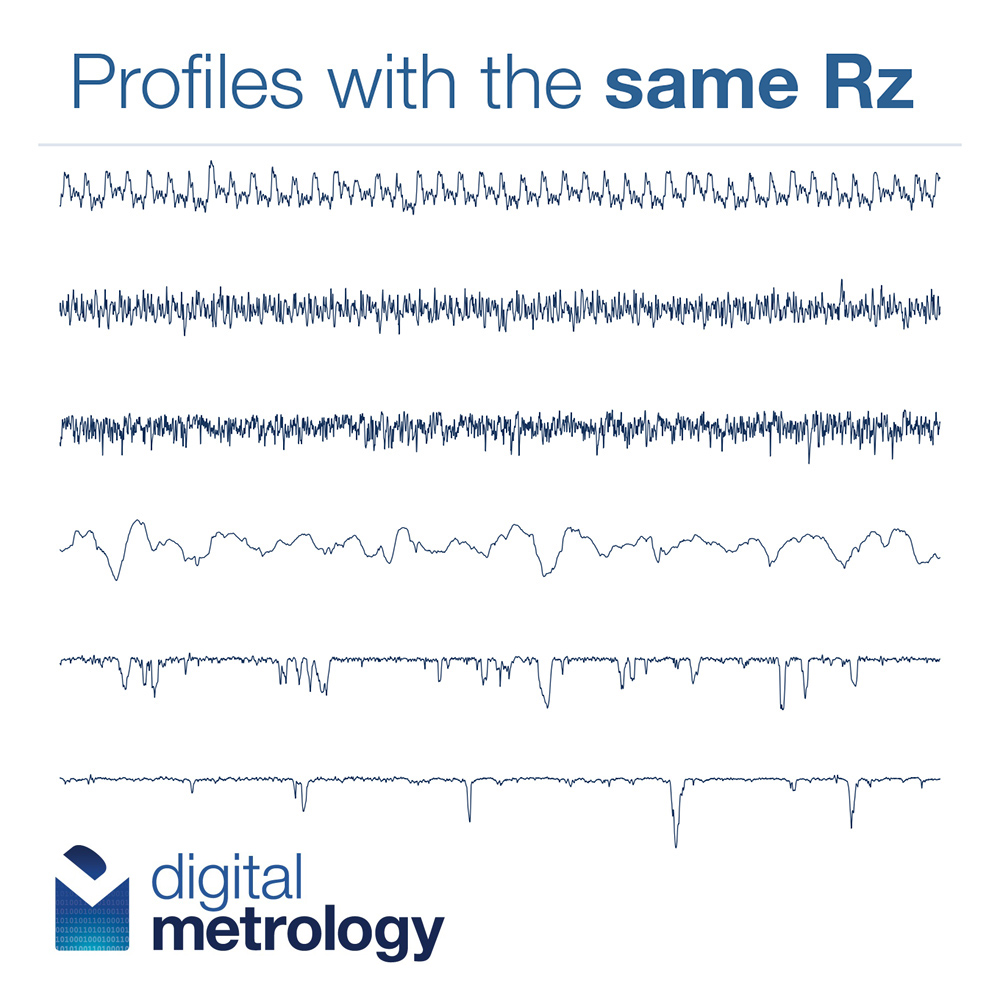
If I scale those surfaces vertically, they all have the same Rz (average peak-to-valley roughness):
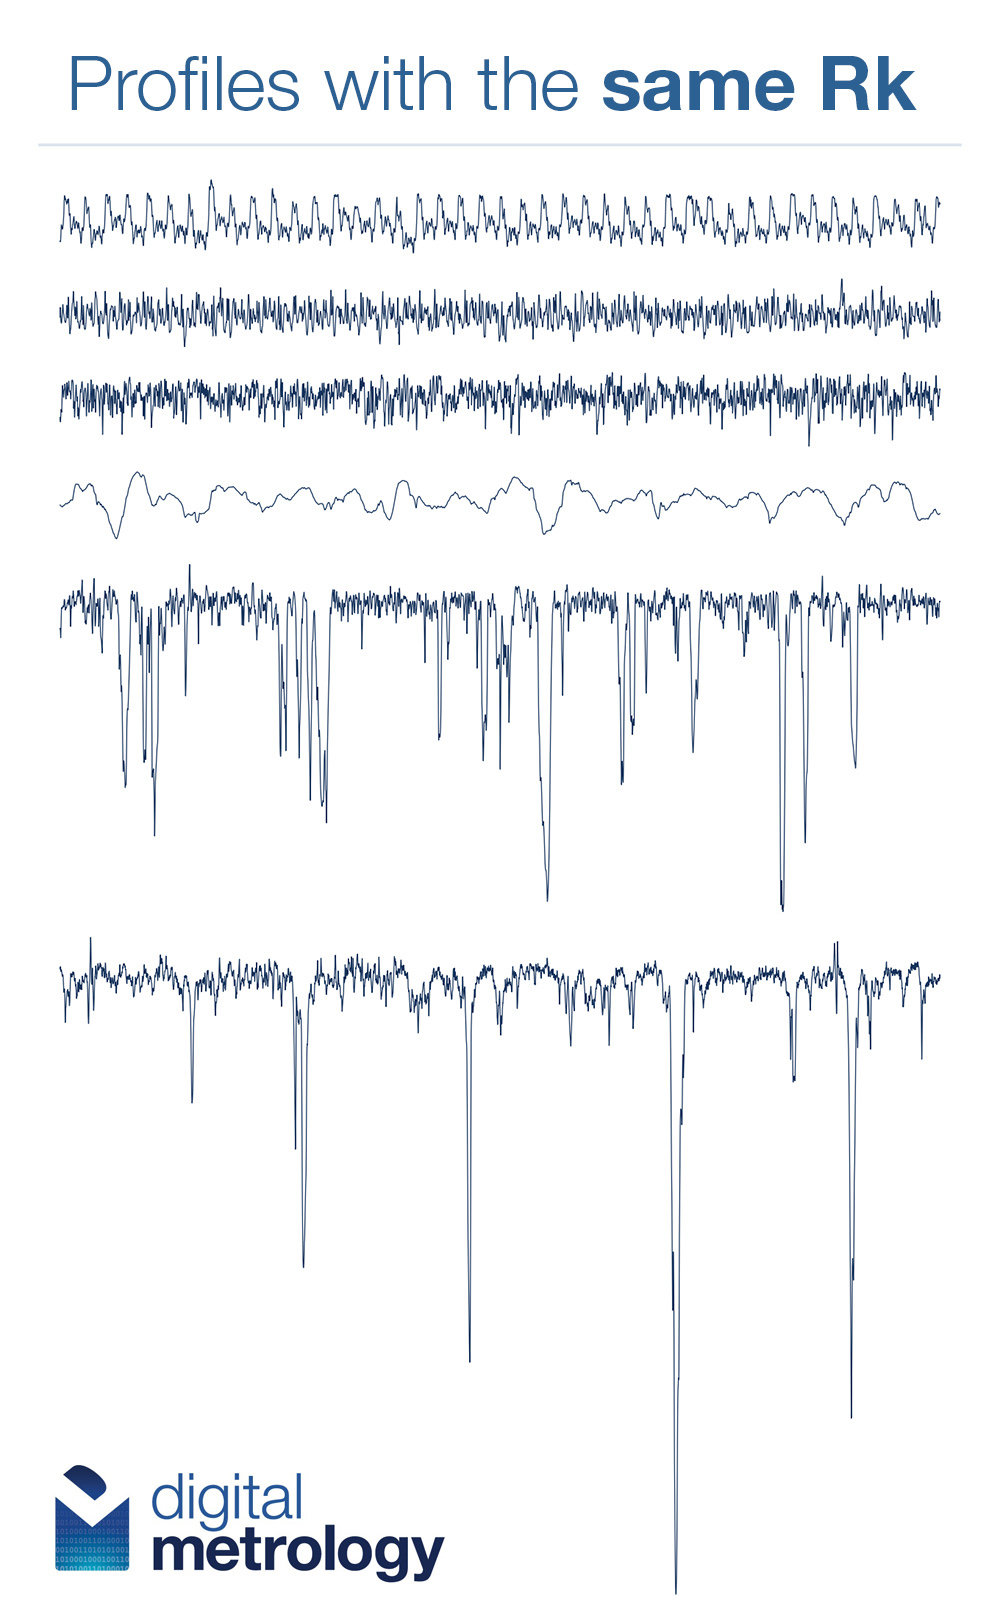
The same holds true even for “advanced” height-based parameters, like Rk (reduced core height), Rpk (reduced peak height), and Rvk (reduced valley depth):
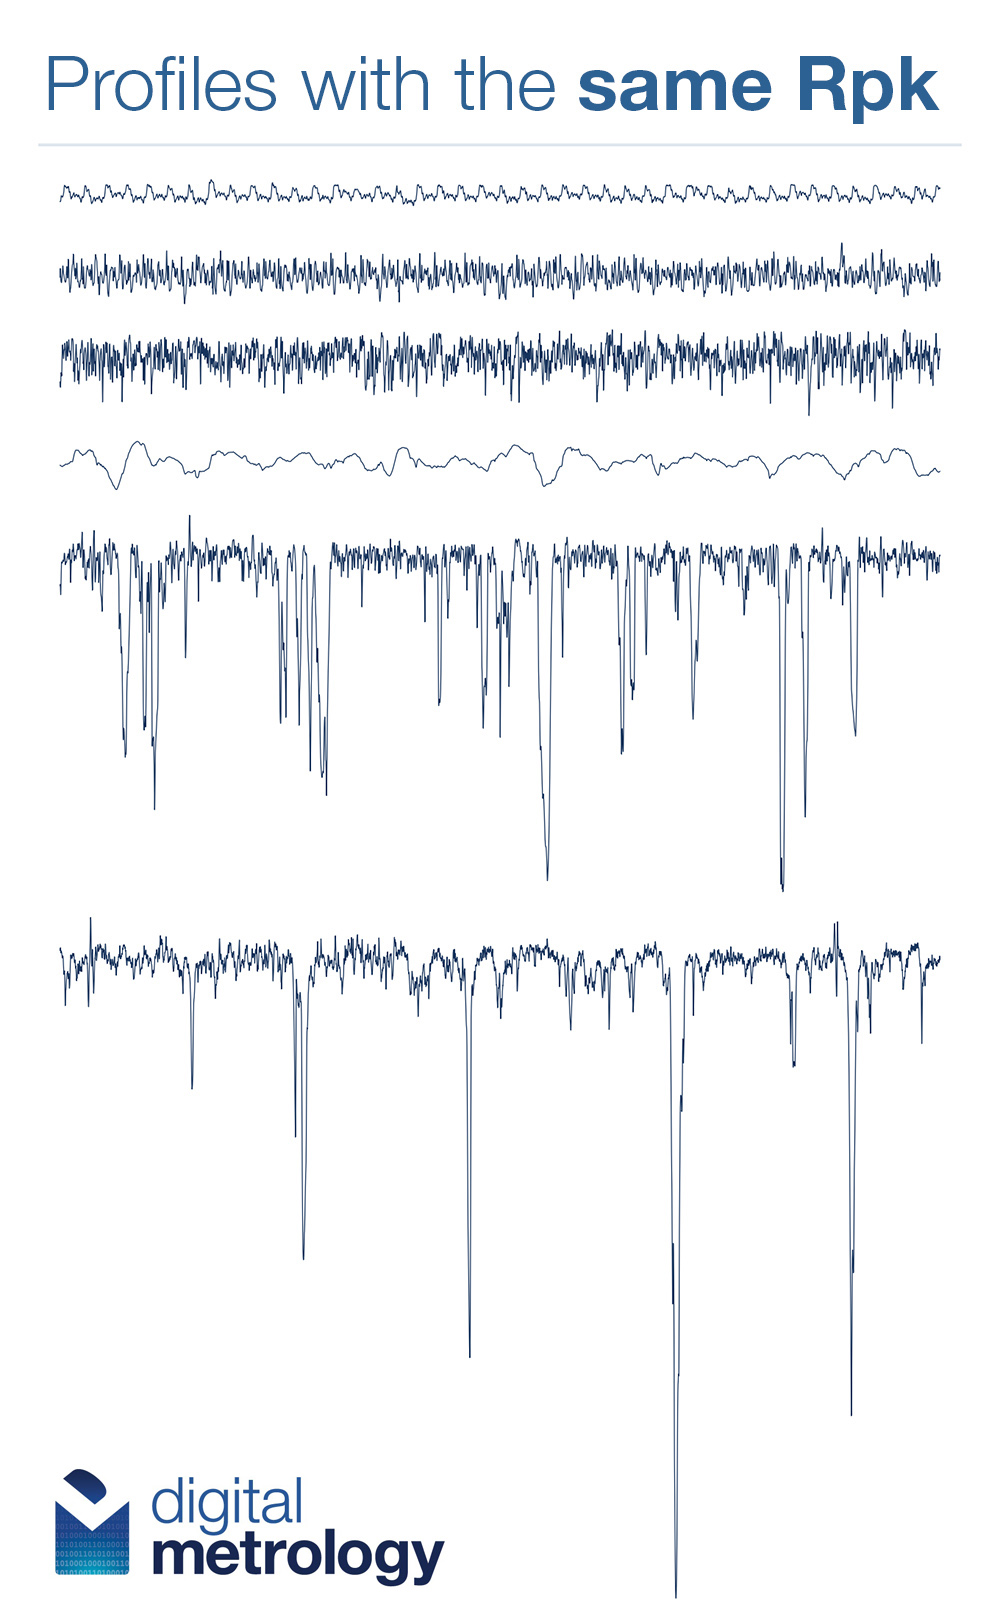
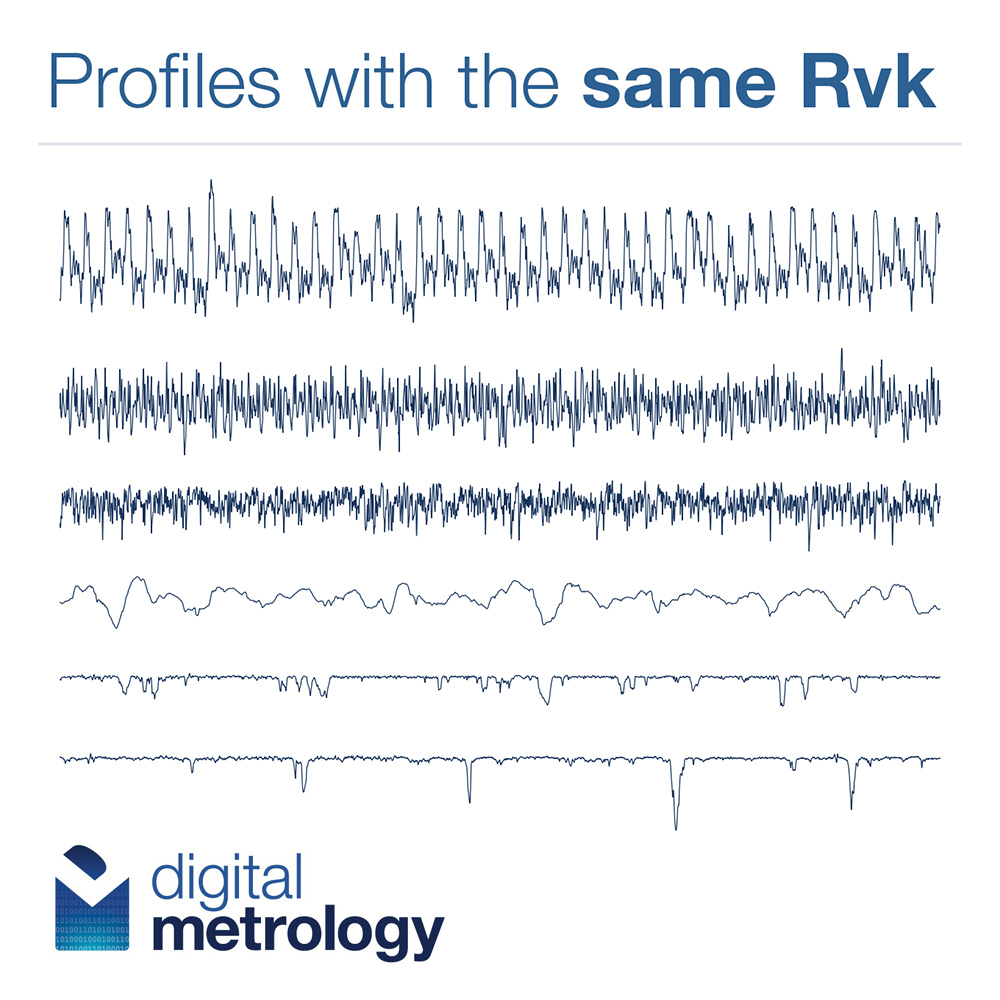
Parameters are like thermometers…
One could look at these charts and conclude that all height-based parameters are flawed. A more helpful way to view it is that no one parameter can always tell a good part from a bad part, in all cases.
Many people treat texture parameters like “go/no-go” gages: if they get a reading below some value, the part is good, and above that value, it’s bad. But shape can’t be described with just one number!
A better approach is to consider surface texture parameters as “change detectors,” tools to flag that a process has changed, You can think of it like a thermometer: if can tell you that you have a temperature, which may indicate that you’re not well…but a doctor will use additional tools to diagnose what’s actually wrong.
You can’t control shape with one parameter
If a texture parameter goes out of tolerance, the next step should be to look at the profile to see what you can learn. Seeing the texture immediately takes you beyond the numbers. You may immediately see unexpected features or patterns, like the deep pits, tall spikes, or repeated patterns that we showed in some of the profiles above.
The next step may be to consider additional parameters, to build a more complete specification of the surface. In doing so, you may learn that a different parameter than the one you’ve been using is better at differentiating “good” from “bad” surfaces in this particular case…or perhaps in most cases!
This is why software such as our OmniSurf, OmniSurf3D, TraceBoss, Bandify, and other software can be so effective in helping control processes AND quickly diagnose problems. The ability to track the numbers helps you to quickly spot process changes, while the ability to see and interact with the data helps you understand the root causes.