Many surfaces are dominated by a repeating, pattern or shape in their texture. Sometimes this texture is desired, as on a gripping surface. Other times it is something we try to avoid, such as “orange peel” in paint, or chatter in a bearing raceway.
In each of these cases it is helpful to isolate the dominant features and measure their geometry. Armed with that information we can understand what effect the pattern may have on performance or appearance.
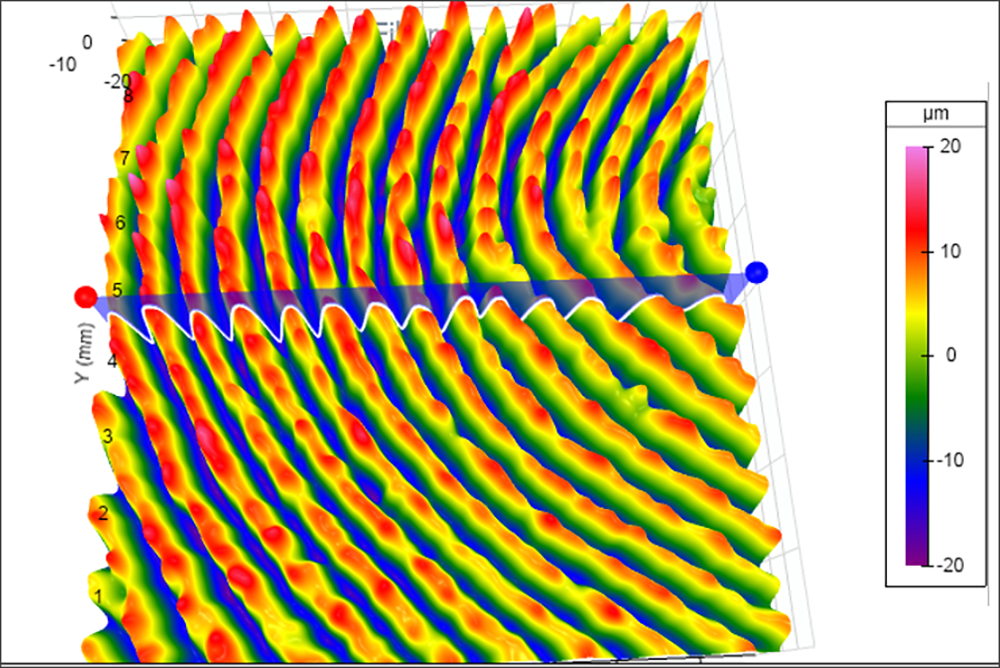
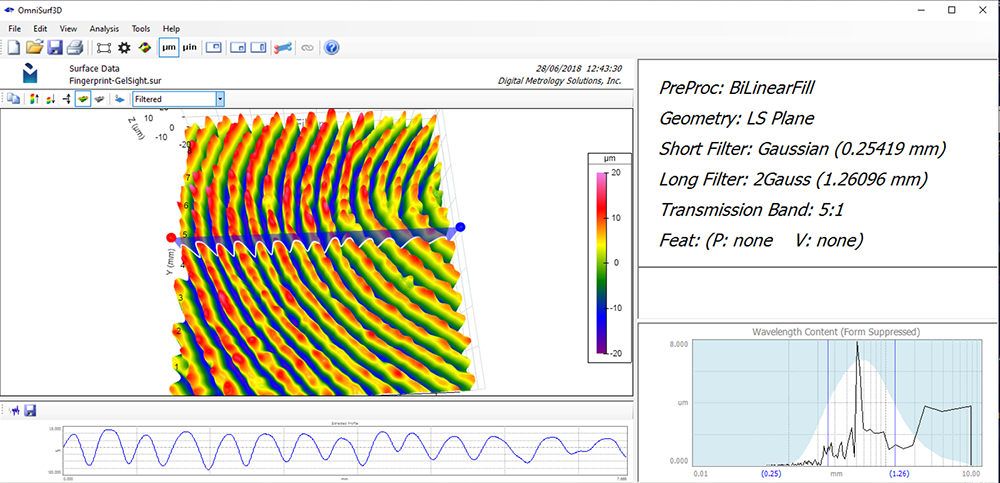
Sometimes the pattern is easy to see and measure. Take, for instance, this 3D measurement of a fingerprint analyzed in OmniSurf3D:
In this data it’s very easy to see the repeating shape of the ridges. If we open OmniSurf3D’s Wavelength Content window we immediately see a sharp spike at 0.5 mm—the spatial wavelength of those ridges.
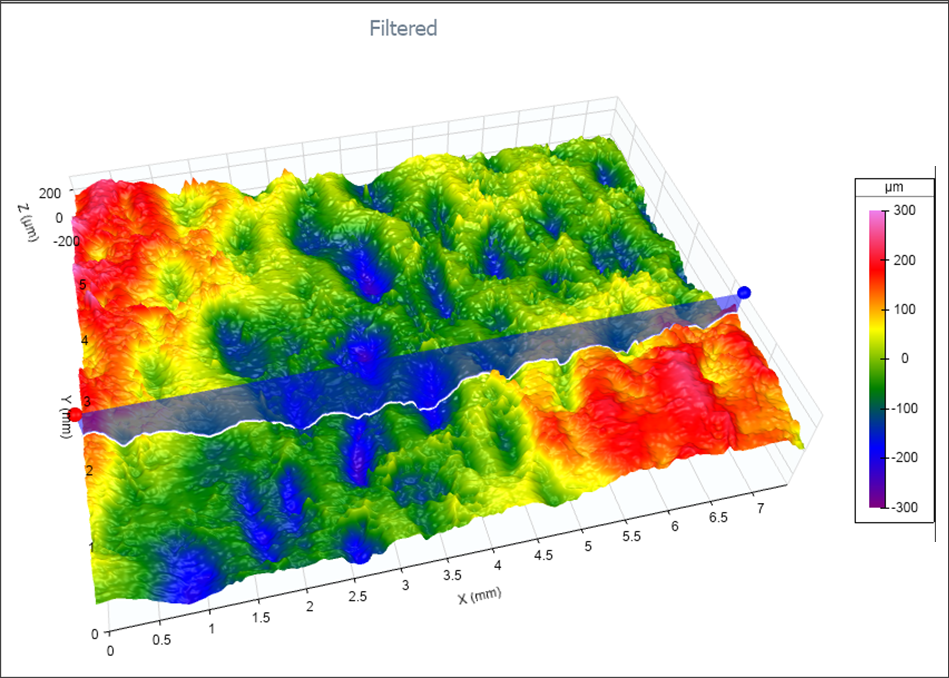
But what do we do when the pattern is not as clear?
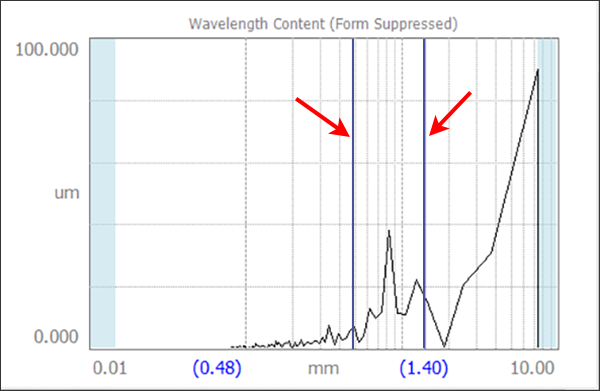
The Wavelength Content window is a good starting point when looking for a dominant wavelength—indeed, we can see something happening in the vicinity of the 1.2 mm wavelength:
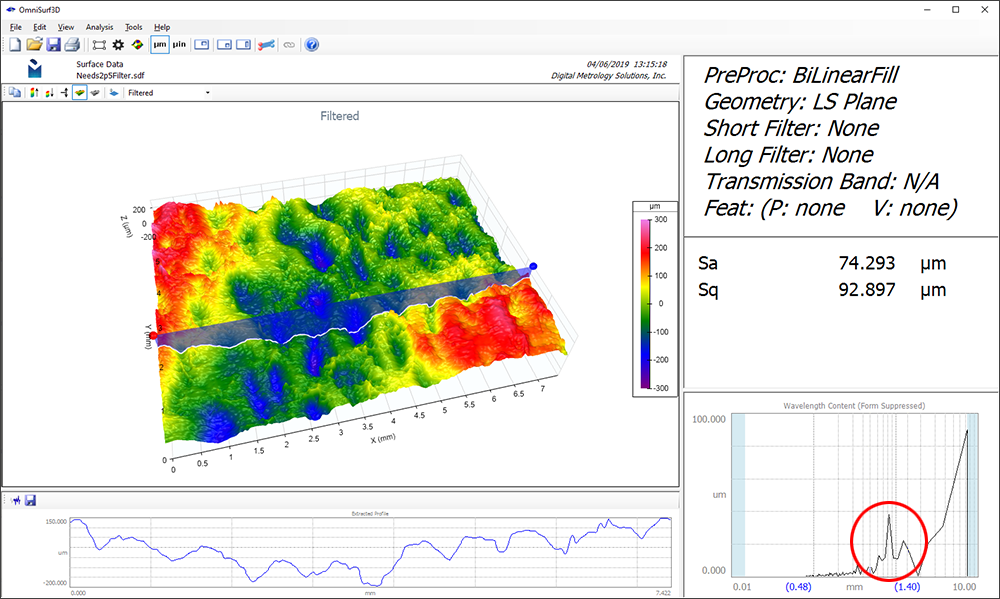
Now, let’s highlight that component of the data and explore it. In most software packages you’d have to dig into the settings at this point to choose filter types, cutoff lengths, etc. But in OmniSurf3D we have a faster, interactive tool. First, drag the cursors in the Wavelength Content window to either side of the dominant wavelength:
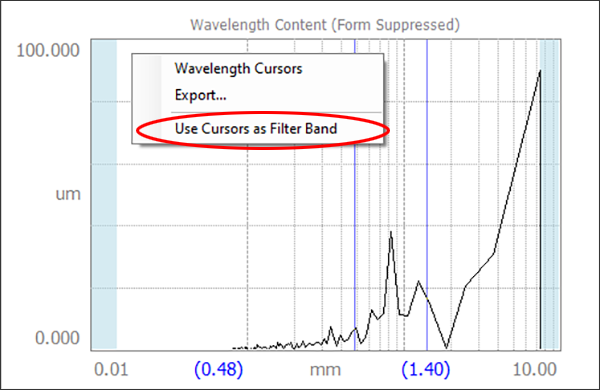
Then, right click in the Wavelength Content window and choose Use Cursors as Filter Band:
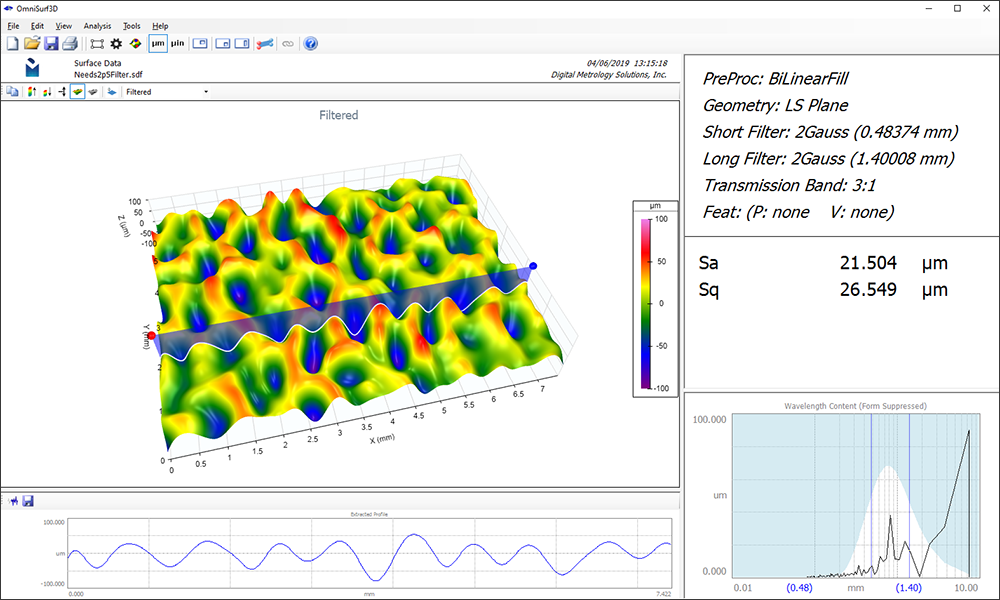
OmniSurf3D will now create a bandpass filter including the wavelengths between the cursors, suppressing the other wavelengths, so you can see the dominant structure:
Filtering the data like this lets you bring out critical aspects that may otherwise be obscure. You might be able to highlight texture caused by tool chatter, or features that may lead to vibration. Or, you may be able to isolate waviness on a gear tooth that will ultimately lead to noisy operation. It’s a simple tool to operate, but one with powerful implications.
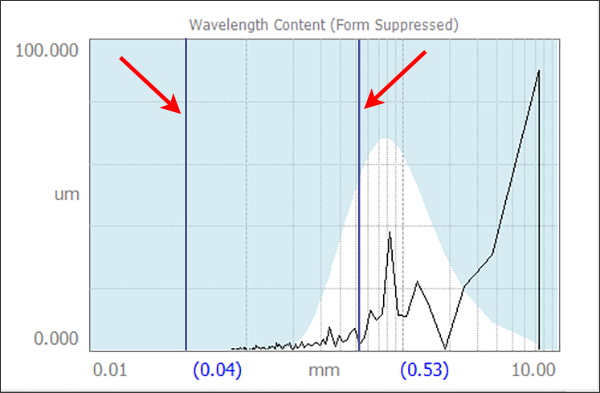
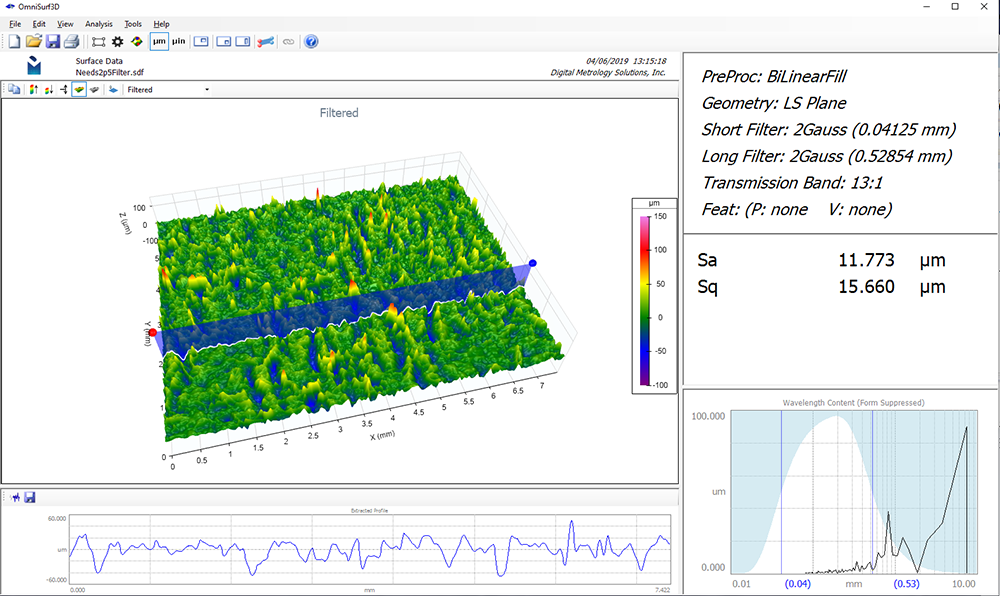
The interactive bandpass filter tool lets you can adjust the cursors to fine tune the wavelength range. Or, you can explore different wavelength regimes—all without hunting for filter settings. Let’s say you want to focus on the fine texture details while excluding the dominant wavelength. No problem—just place both cursors below or above the dominant wavelength:
OmniSurf3D will again show you the band of wavelengths based on your selection:
The interactive bandpass tool is one of the many ways that OmniSurf3D makes texture analysis faster and more informative, without overwhelming you with settings. Check out the OmniSurf3D solutions page, or contact us to request a 10-day trial version to see it in action for yourself!

