Here’s a fun “macro” example of an important aspect of micro surface texture.
Peak curvature is a measure of the “sharpness” of the small peaks in a surface. Many papers have been written on this important tribology parameter because it relates directly to a number of surface functions. But if you’re trying to estimate peak curvature using a stylus measurement, your numbers may mislead you. A 2D stylus measurement can report smaller radius values that aren’t real. Here’s why.
“Macro” radius measurement
Let’s say this bowl of marbles is our surface:
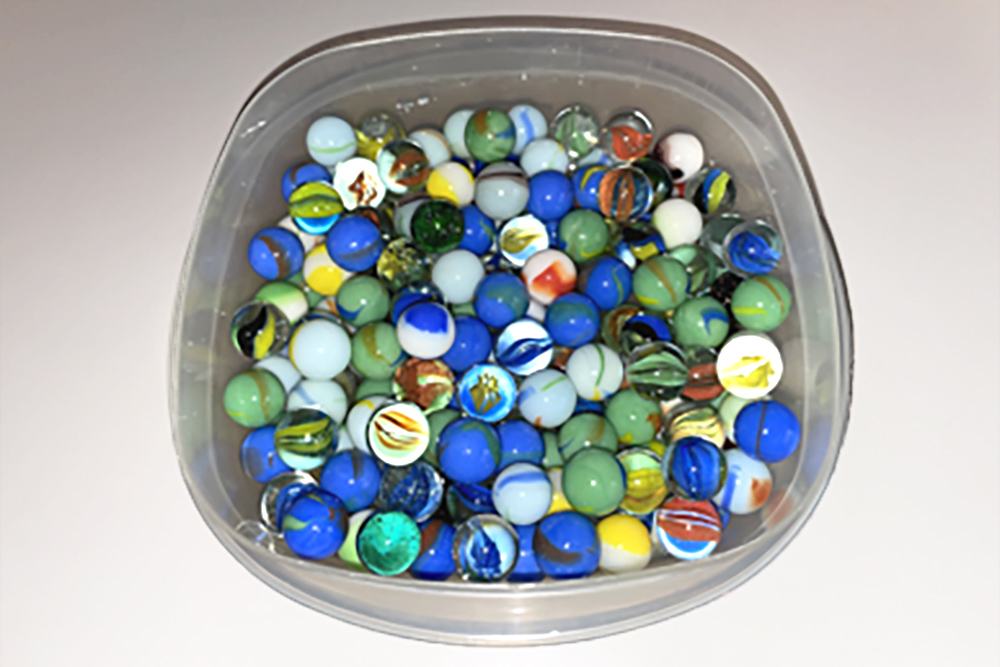
There’s an overall shape to the pile, with a lot of locale curvatures (i.e., marbles!).
If we scan the bowl in 3D, we should be able to see the radius of most of the marbles in the field of view. A 3D scanner (Metrascan Black from Creaform) gives us a good “macro” measurement of the marbles (thanks to Brian Vogel for the data!)
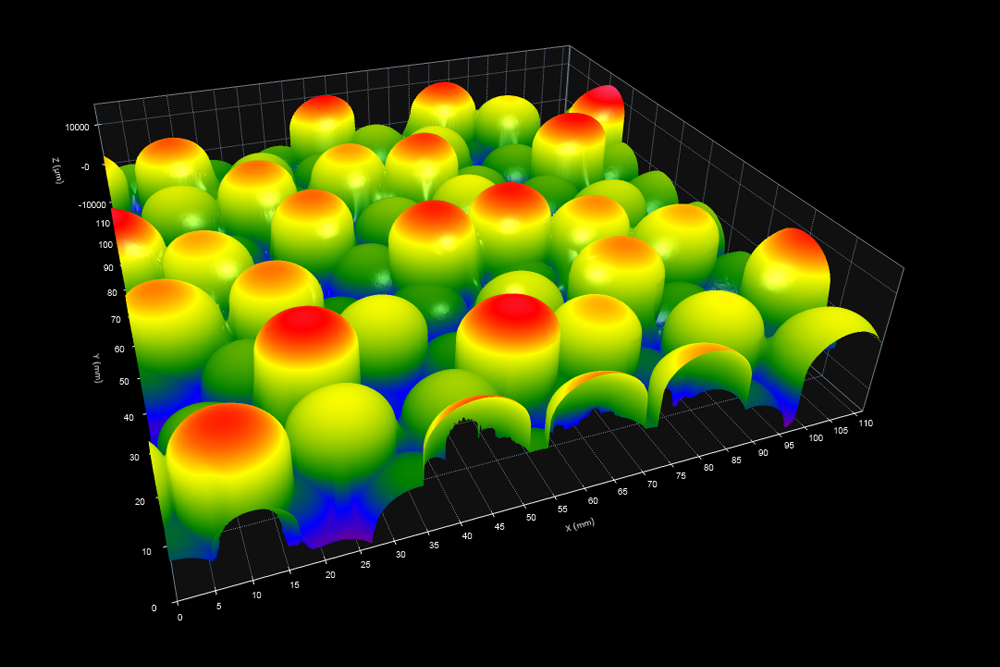
We can see all the way across most of the marbles in the 3D data, so we should be able to estimate their radii pretty closely. And in fact, if we bring this data into OmniSurf3D software (and spend a little time with circle masks), we can measure the radius of quite a few of the marbles. The resulting measurements are tightly distributed around 8mm—which is the actual radius of these marbles.
“Micro” surface texture measurement
Now, let’s approximate what might happen if we measured the “micro” version of these marbles using a stylus. We can estimate that pretty well by taking a 2D profile slice through the 3D data:
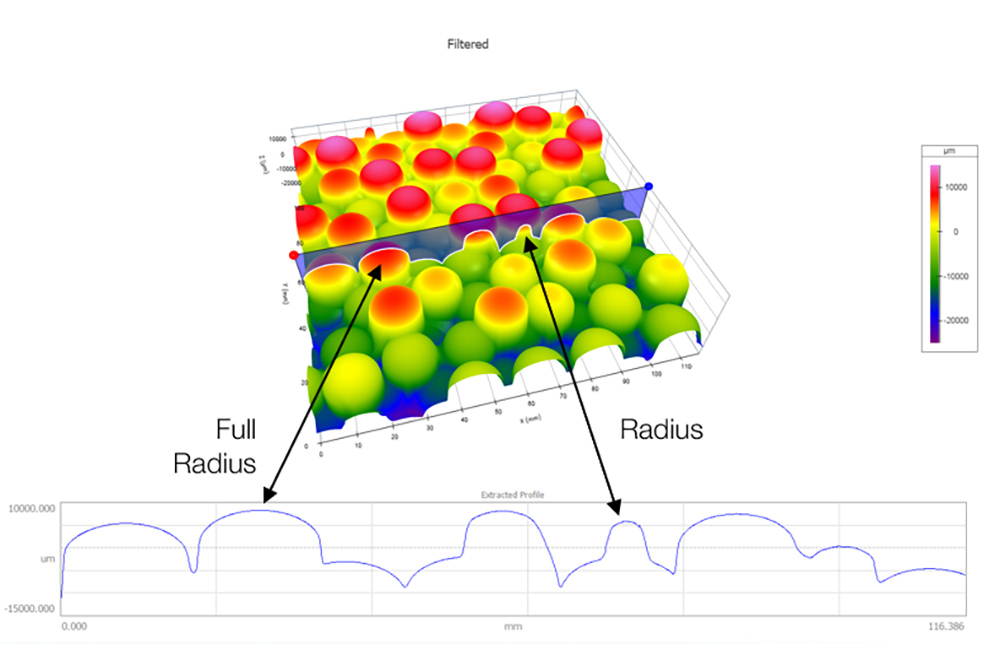
Wherever we choose to make our measurement, the profile will cross some of the marbles near their equators and cross others closer to their edges. Depending on where our profile crosses the marble, we get very different radius values, as the image above shows.
The distribution of the measured radii now looks more like the blue data in this chart: scattered, and with a much lower mean.
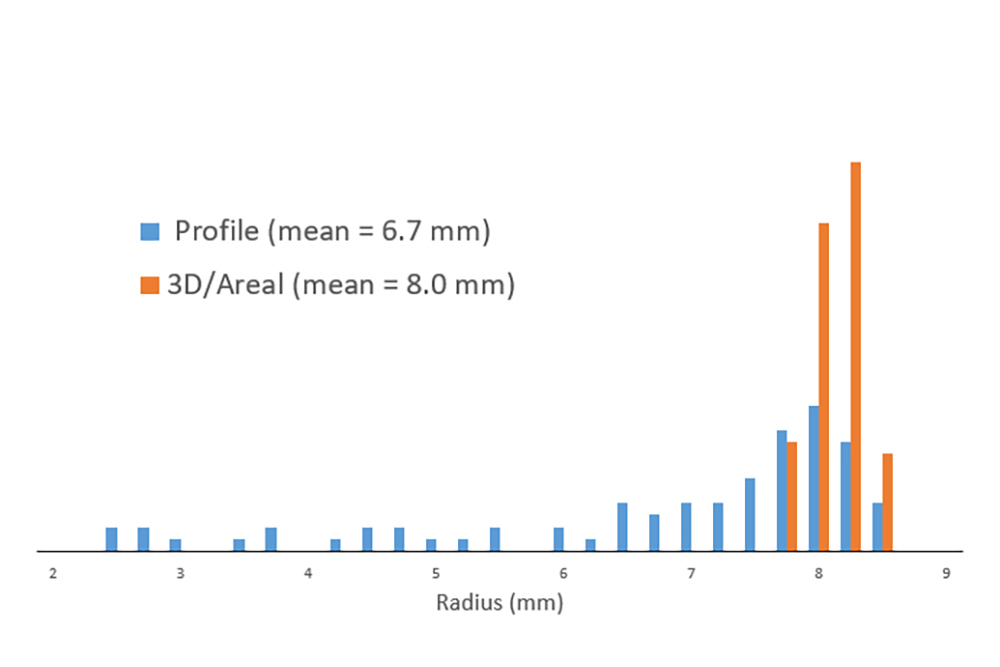
That data could lead us to some incorrect decisions about the peak curvature. If we are using this data to control a process, we might start making adjustments to fix a problem that is not really there. Or, a problem may be sneaking past us, even when we think we are keeping it in control.
Peak curvature is one of the parameters that can benefit greatly from 3D measurement. When it’s important to accurately capture the deepest points of valleys or highest points of peaks on a surface, 3D measurement can be more repeatable. But remember: 3D measurements are typically limited to a very small field-of-view, so you need to be sure that the area that you measure is representative of the larger surface! As always, the application dictates the parameters that we need to measure, and the equipment that we need to use to measure them.
Want to try it for yourself? The dataset is in our Surface Library!