If you work with coatings, electrical contacts, sliding surfaces, substrates for painting, etc., you know that controlling surface peaks can be the difference between a functional part and a failed one.
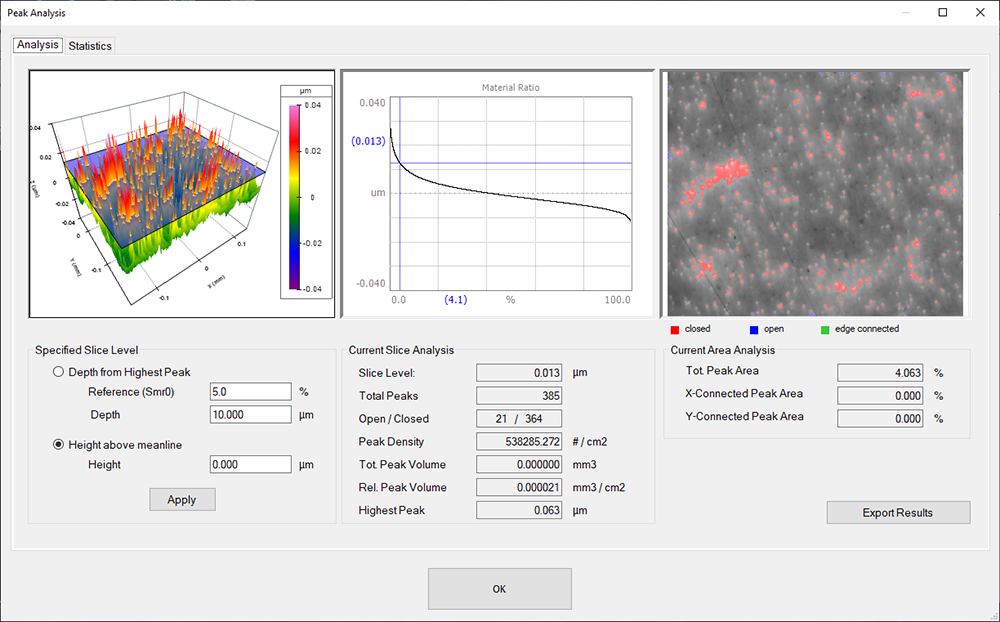
The Peak Analysis in OmniSurf3D is an interactive tool for visualizing the peak material. Click and drag the cutting plane on the Material Ratio plot to see the peak material content above any height level. A transparent, 3D cutting plane gives an instant visualization. A color map provides information regarding closed peaks, peaks that touch image edges (open) and ridges that connect from top-to-bottom or left-to-right (edge connected).
As you move the plane you’ll see numerical results for the number of peaks, peak volume, density, highest peak, and much more information. These values update in real time as you interact with the graph for the fastest possible analysis and quickest path to understanding your surfaces.
Added features make exporting easier
We have now added a second Statistics table to the Peak Analysis. It summarizes the position, height, area and volume of all of the peaks at the cutting plane position. It also updates automatically based on the cutting plane depth.
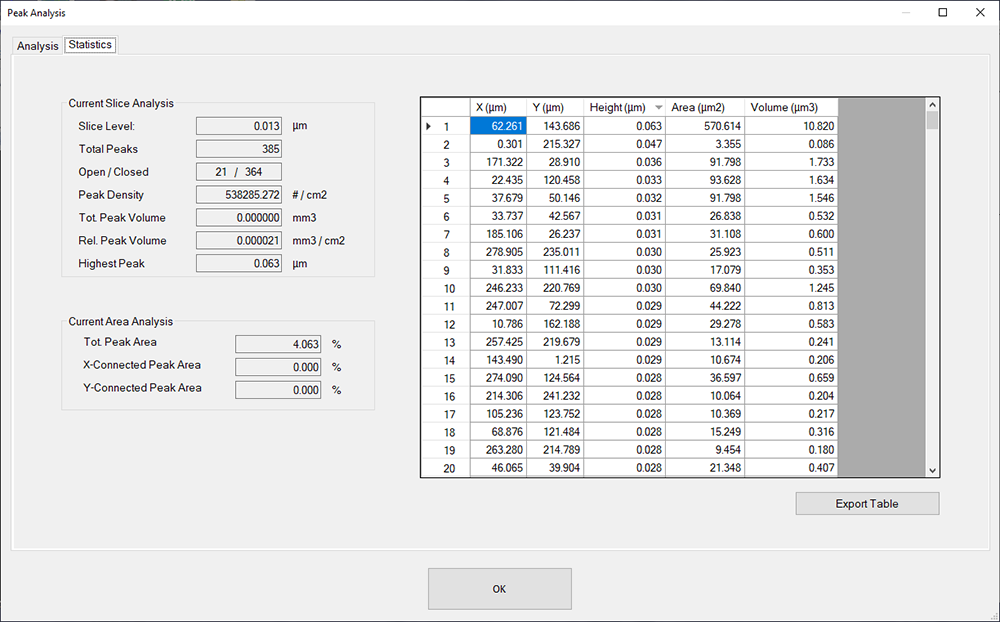
Do you want to know more about the 10 highest peaks? Click the “Height” column heading and the table will be sorted by heights. In fact, you can click on any of the columns in the table to sort by those parameters. When you have the data just as you need it, click Export to get all of the peak information in one .csv file—ready for other analysis and reporting using packages such as Microsoft Excel.
Sound useful? Want to give it a try? Click here to request a free 10-day trial of OmniSurf3D!