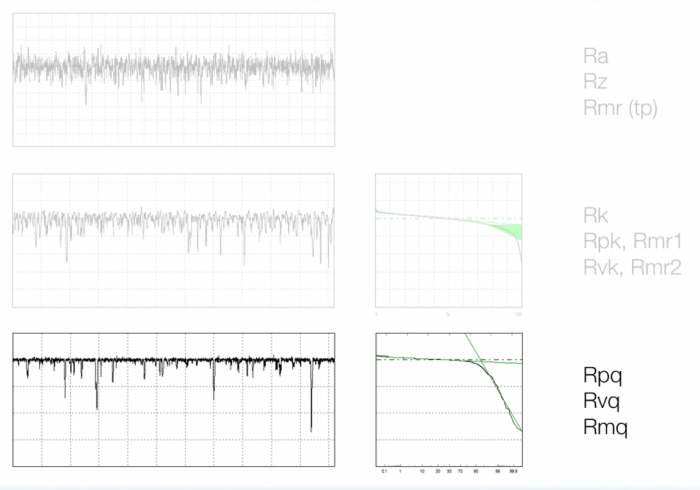
All plateau honed surfaces are not created equal. The image below is the heart of the story, and the focus of this article. In this image you see three honed cylinder bore surfaces with very different characteristics. As it turns out, each is best controlled using different sets of surface texture parameters.
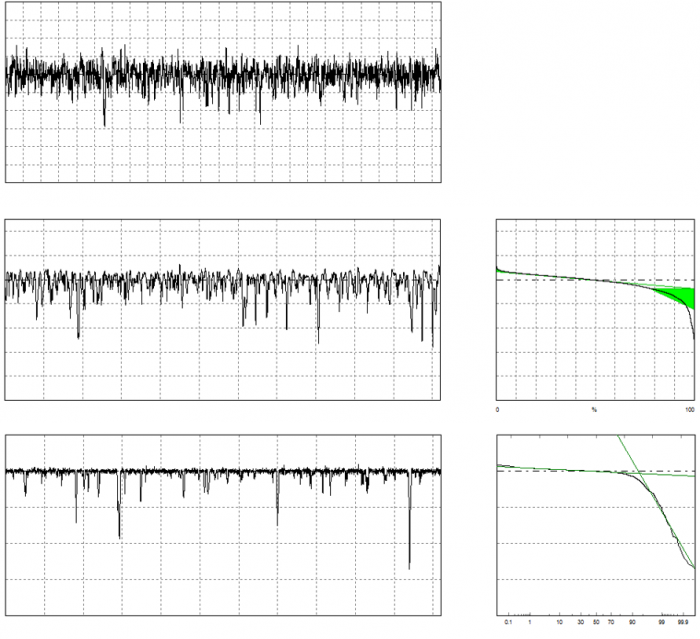
Three types of honed cylinder surfaces. We will see that each requires different parameters to describe them.
Conventional height parameters are sufficient for single honed surfaces
The top profile in the image shows a conventional surface made with a single honing operation. The texture is made up of peaks and valleys of all depths. The valleys might be slightly deeper than the peak heights–but nothing too significant. Over the initial run-in period the action of the engine wears away the higher peak material, leaving a surface with smooth plateaus and valleys in between to retain lubricant.
Traditional roughness parameters such as Ra (Average Roughness), Rz (10-point Roughness Height) and Rmr (Material Ratio) are often sufficient to control the honing operations for a conventional, single honed surface.
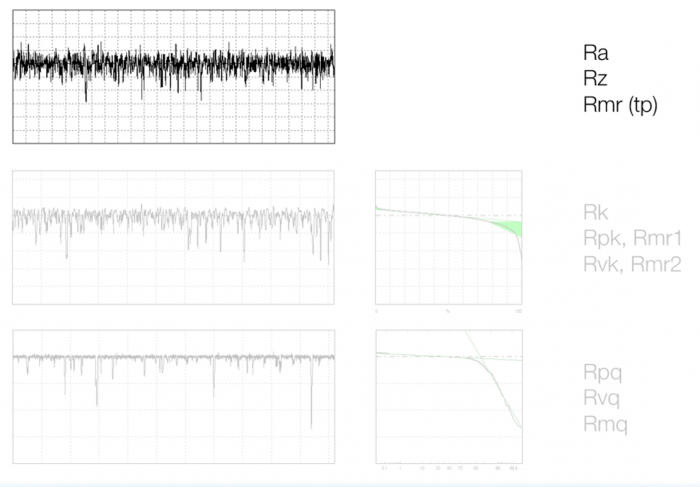
Conventional parameters (Ra, Rz, Rmr) are often sufficient to describe single-honed surfaces.
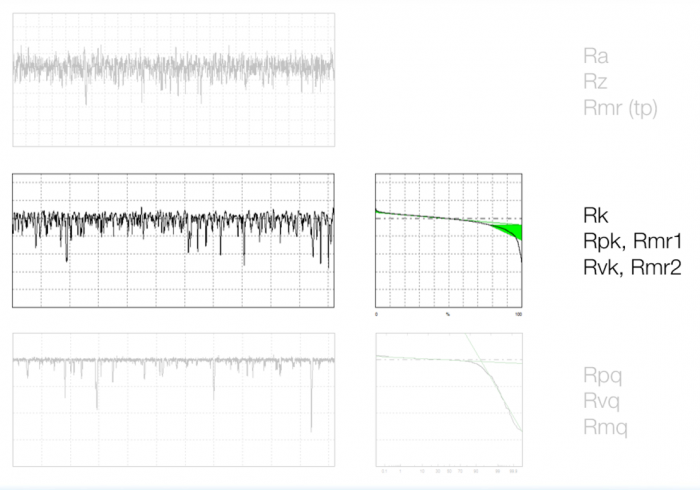
Plateau honing leads to the K family parameters
While straightforward to manufacture, single honed surfaces do have drawbacks. The wear that occurs during break-in inevitably creates unwanted gaps/leakage as well as debris. Both factors can reduce engine performance.
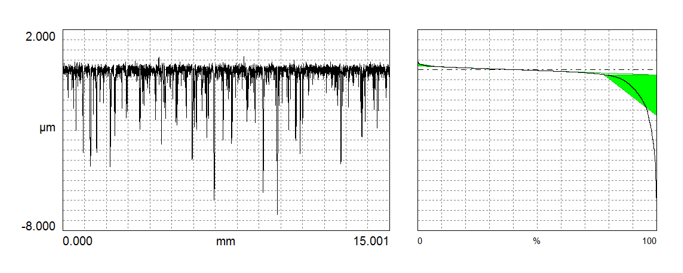
As emissions and performance standards grew tighter, manufacturers began creating “plateaued” surfaces in order to reduce break-in and improve sealing. Plateau honing uses rough honing to make the valleys, followed by finer honing to create the plateaus. A “plateau honed” surface is shown in the second profile.
But with these improved surfaces came a new challenge: the Ra, Rz and Rmr could not robustly distinguish a plateau honed surface from a single honed surface. Very different surfaces gave similar values for the parameters when dealing with this class of surface.
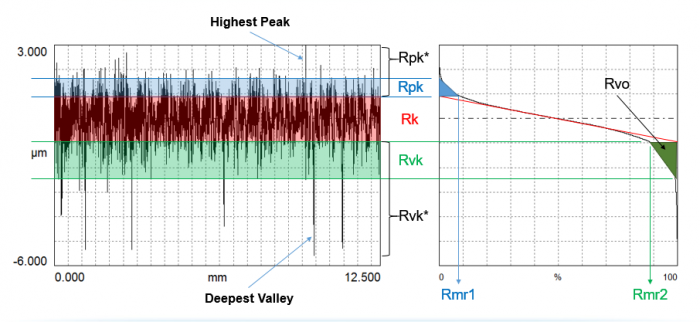
In order to better describe and control these new surfaces, researchers developed and applied the Rk family of parameters. The Rk family is based on the material ratio curve, shown below on the right. The individual parameters (Rk, Rpk, Rmr1, Rvk, Rmr2) quantify the peaks, valleys and kernel regimes. They allow for better control of plateau honing as they are more targeted toward the individual geometries within the surface.
The Rk parameters are well-suited to describing plateau honed surfaces that have distinct plateaus, kernels and valleys.
High performance surfaces need better parameters: Q parameters
High-performance applications (for example, diesel and racing engines) require surfaces that are more extremely plateaued, as in the third of our profiles.
For these applications, manufacturers create very smooth plateaus with discrete valleys, to optimize friction, clearance and engine temperature, with virtually no run-in period. The primary characteristic of these surface is a strong distinction between the peaks and the valleys. There is a clear visual indication of where peaks meet valleys.
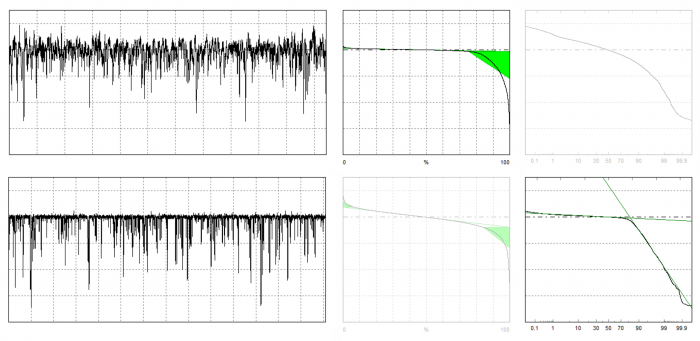
Unfortunately, again, the existing texture parameters proved insufficient to describe these surfaces. When a surface is extremely plateaued, the Rk parameter model does not fit the material ratio curve as well. This becomes apparent in the material ratio curve shown below. Looking at the green area we see that there is no exact position on the curve at which the plateaus give way to valleys (as indicated by the left corner of the large, green triangle.) Thus, the Rmr2 and, subsequently, the Rvk parameters become unreliable.
In a high-performance engine the distinction between plateaus and valleys, is almost non-existent, which makes the Rk parameters unreliable.
For extremely plateaued surface we turn to the Q parameters family. Rather than using the material ratio curve, the Q parameters are based on a “material probability” curve, shown below on the right. This curve is a representation of the material ratio curve with percentages mapped to standard deviations. When doing so, we see the two distinct distributions (plateaus and valleys) as two clearly linear regions. Furthermore, these linear regions produce a sharp knee on the curve. The Q parameters (Rpq, Rvq, Rmq) derived from this curve can robustly distinguish the surface regimes for extremely plateaued surfaces.
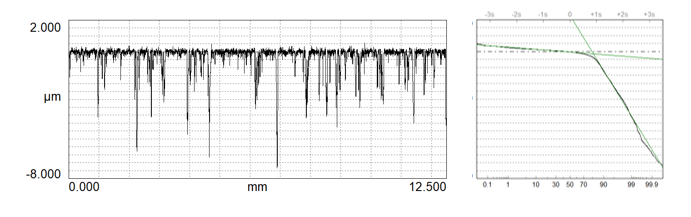
For extremely plateau’d surfaces the Q parameters, based on the material probability curve, are most robust.
When do I use K or Q Parameters?
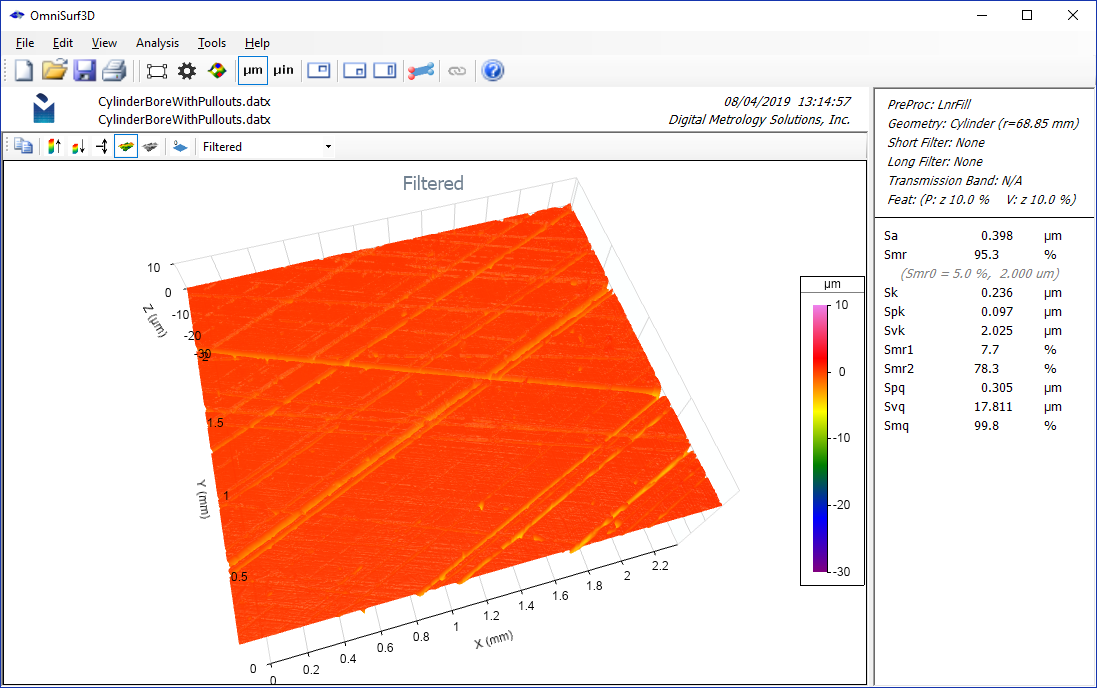
Today both the K and Q parameters are specified in the ISO 13565 standard as well as other upcoming 2D (profile) and 3D (areal) standards. Digital Metrology’s OmniSurf and OmniSurf3D include both sets of parameters as well. Unfortunately, the standards leave out a “user’s guide” to tell us when to use one set of parameters or the other.
What we find is that each set of parameters has its use. The Q parameters work best on two-process surfaces with discrete plateau and valley regimes. However, the Q parameters, are less reliable when the distinction between plateaus and valleys is fuzzier. In some cases where the surface isn’t distinctly plateaued, the standardized mathematics for the Q parameters may provide no results at all.
The K parameters work well for many surfaces for which extreme plateaus are not required. This includes not only cylinder bores, but gears, bearings, transmission components and many other surfaces required a degree of sealing and/or friction control.
K parameters serve well for surfaces like the top profile, while extremely plateau’d surfaces are best described by the Q parameters.
And, let’s not forget Ra and Rz! These basic parameters still provide useful feedback for surfaces with a wide distribution of peaks, valleys and intermediate heights.
In any case, the best way to analyze your plateau honed surfaces is to explore and interact with your data. The numbers alone may not tell the whole story. Digital Metrology’s OmniSurf and OmniSurf3D software packages provide all three sets of parameters along with powerful visual tools to help you see what works best for your surfaces.
We have an excellent video here showing the Plateau Honing analysis in OmniSurf3D software. If you are honing, you should take a few minutes to check out how quickly and easily you can explore your surface data.
 View our video here on OmniSurf3D’s Plateau Honing analysis.
There’s a lot more to talk about on this topic. In fact, Digital Metrology even offers consulting and seminars on surface texture analysis and plateau honing. If you have questions or would like to know more, please give us a call or contact us.