If you work in manufacturing you likely think of “surface texture analysis” as a tool for quality control or for improving functionality. But there are many applications beyond the factory walls in which surface analysis can lead to new discoveries or new ways of looking at the world.
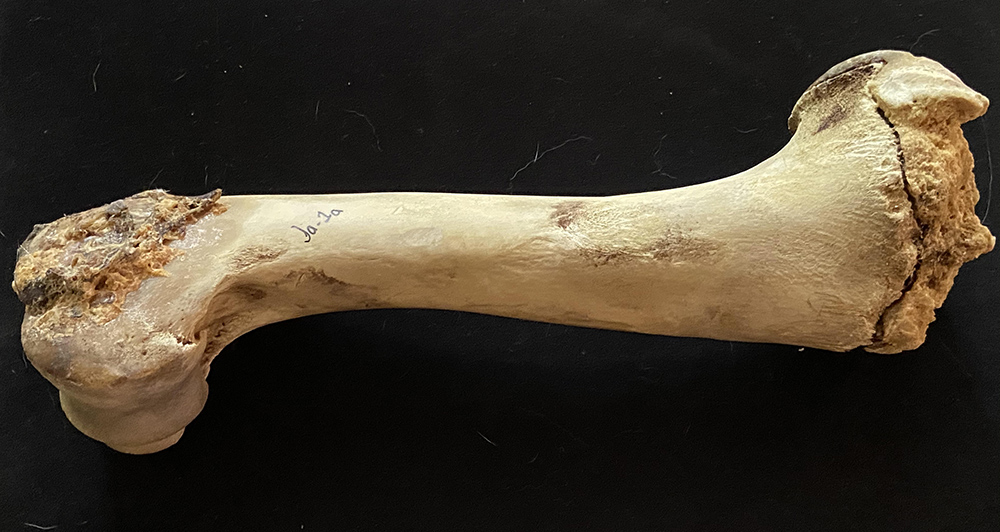
Carrie Rowe is a doctoral candidate in the University of Minnesota’s Department of Anthropology. Her work focuses on analyzing the texture of fossilized bones—and recent bones as well. Rowe and her team are able to discern whether marks on bones were caused by tools, weapons, bacterial modification, fire damage, insect action, etc. They can even distinguish the type of implement or animal that left the marks. This information helps researchers to estimate the age, manner of death, health and diet of the subject. The applications extend into forensics as well, helping law enforcement entities to pinpoint the time and manner of death in some cases.
Surface texture analysis tools are often not geared toward scientists
One of the big challenges for Rowe and others in her field is that much of their analysis is based on qualitative interpretation of surface texture. “Reproducible data has always been a problem,” said Rowe. “The usual approach is to look at a sample under a microscope or SEM and then describe it. The trouble is, if you have a bias, you will tend to see it.”
Rowe said that advanced surface texture analysis has not been widely used in her field, to date. One seminal paper on analyzing the texture of bones only took into consideration the average roughness of the samples. If you are a frequent reader of this blog, you know that they were missing the best parts of the story! The important information is typically revealed by comparing roughness and waviness, by narrowing the wavelength domain being measured, etc.
The reason that surface texture analysis is not more widely used in scientific fields lies, in part, in the available tools. Much of the software for surface analysis has been designed for metrology specialists working in manufacturing industries, so the terminology and tools are geared toward those applications. There is often little in the way of a road map available as to how to use the software, beyond thick manuals.
It’s not surprising, then, that technicians, scientists and even engineers often think of “surface analysis” as measuring a single number. And, it’s not surprising that the researchers who wrote the paper mentioned earlier only considered average roughness: the tools for more advanced exploration were essentially buried and out of reach.
Analyzing bone samples—without a road map
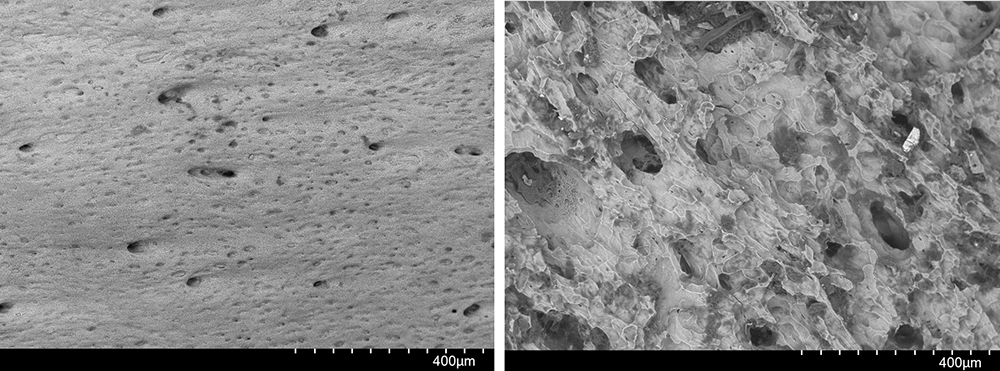
Rowe came to Digital Metrology to assist in interpreting the markings on some bone samples which had been modified by bacterial action. She and her team had access to a scanning electron microscope and an optical 3D profiling system. “In the micrographs you can see differences in the surface morphology perfectly,” said Rowe. “My expectation was that the quantitative data [from the optical system] would be able to distinguish the surfaces easily, because they look so different.”
Yet when Rowe measured the surfaces, the average roughness (Sa) of the samples was not proving useful. “These two surfaces keep plotting together and I was having a hard time distinguishing them, quantitatively, from one another. I knew this was because I was just doing something wrong.” But the software she was using gave no guidance.
Filtering begins to tell the story
As with most surface analysis, the first thing Rowe needed was a way to parse out the meaningful content of the data from the unimportant. Our OmniSurf3D software is designed for users just like Rowe: people who can benefit greatly from the analysis tools but who are not (and don’t intend to be!) metrology experts. OmniSurf3D guides users through the four basic analysis steps: Pre-processing, Geometry, Filtering and applying Parameters. In this case, filtering turned out to be highly effective. Rowe knew that the bacterial action on the bone samples occurred at lateral scales on the order of a few microns. However, the unfiltered data from the samples was dominated by much longer wavelengths—the shape of the sample itself—which effectively reduced the important information to noise. Filtering out this longer-wavelength “waviness” left just the shorter wavelength “roughness”…and now the data became interesting!
“This was so exciting,” said Rowe. Filtering the data by wavelengths proved eye-opening. “I didn’t know I needed to know about the roughness.”
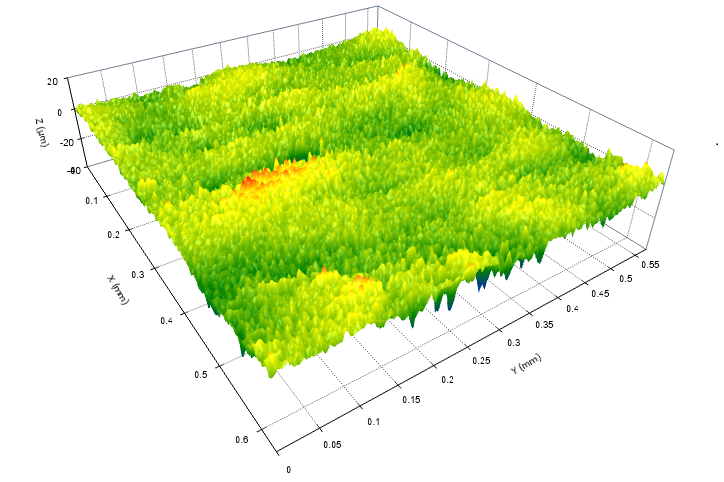
Surface topography of a bone sample. Courtesy Caroline Rowe, University of Minnesota
Digging deeper
Having seen how much information could be learned by filtering the data, Rowe pushed on to examine the samples using a number of more advanced tools in OmniSurf3D. The Pit/Porosity analysis proved useful for understanding how much of the surface was pitted at any given depth. Morphological Filtering—one of the more powerful features of OmniSurf3D—gave an even better look at the pit regions. Surfaces which were indistinguishable using just Sa could now be readily differentiated, and “bacterial action” could be distinguished from other modifications, with hard numbers to back up the visual observations. Maybe most importantly: with OmniSurf3D Rowe was able to establish repeatable “recipes” for analyzing surface that would allow her and others to use the software in repeatable ways and compare their results.
Quantitative data means the science can advance
Rowe noted that OmniSurf3D made it easy to move from basic surface concepts to advanced analysis tools, which was a big contributor to her research. “We had been using another software, and their techs had not even mentioned morphological filters—they said I’d never need them. Yet here we were using them and seeing what we needed to see.”
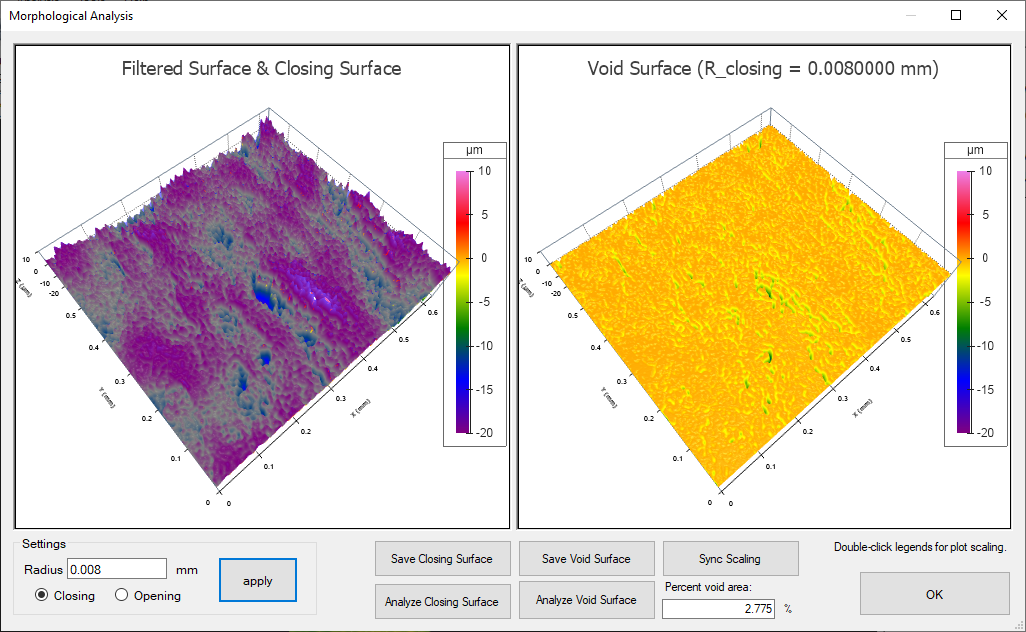
OmniSurf3D’s morphological closing analysis of a bone sample reveals sharp surface voids.
Rowe said that she is now planning to apply the techniques she learned to explore a wider variety of samples. She is looking at methods to distinguish u-shaped from v-shaped marks, which can tell whether a feature was made by a tooth versus a tool. She also hopes to be able to examine the texture inside of the marks to potentially determine the type of animal or tool that left them, which would be hugely helpful tool for anthropologists and forensic specialists.
“I have lots of data to analyze and I’m going to try to use OmniSurf3D to do the majority,” said Rowe. “I absolutely LOVE it!”
Interested in learning how OmniSurf and OmniSurf3D can help in your application? Contact Digital Metrology today!