Here’s a common challenge: your vendors and/or customers are using different equipment to verify part quality…and their results conflict. How can you determine which system is “correct?”
Here’s another common issue: you have a new measurement requirement, but you’re not sure which instrument can do the job best. Vendors give you specs, and even demos, but it’s still hard to determine the “winner” for the given application.
An impartial third party
Digital Metrology has been helping customers deal with these types of issues for, literally, decades. We’ve seen virtually every type of surface measurement system, which lets us be unbiased (and brutally honest!) about what a system can do, can’t do, and sometimes shouldn’t do.
You can take advantage of our expertise when you’re:
- buying a new gage
- developing a new process measurement
- comparing results with vendors and customers
- addressing a disagreement between systems
- determining whether a system’s performance has changed over time.
Our job is to provide an unbiased assessment of how equipment, techniques, and parameters serve a particular quality requirement. We give you data so you can determine the best options and make the best comparisons.
Instrument manufacturers even trust us to see how their systems stack up against the competition!
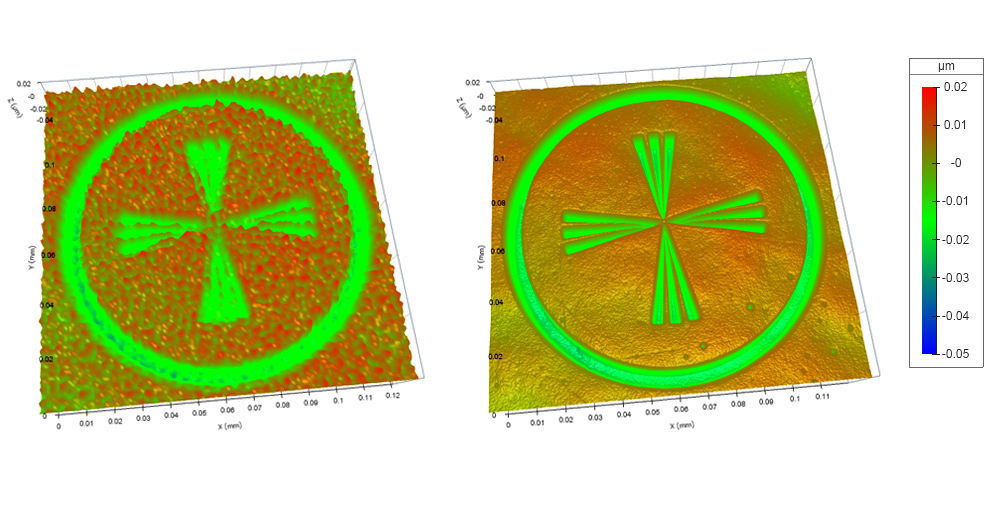
Siemens stars like these can help compare lateral resolution between two systems.
A library of reference surfaces—and the expertise to use them
Comparing systems always starts with a reference surface that everyone can trust. References are expensive, though, and it’s not always practical for companies to purchase them.
Digital Metrology has strategically collected a library of reference specimens over the years that we use to compare and validate results. We have years of measurement experience to know how to use them most effectively, and to know how to separate the surface from the measurement system errors. It can be a subtle business—and it’s how we give our customers an unbiased, data-based assessment of their measurements and equipment.
Here is a selection of our reference specimens and aids:
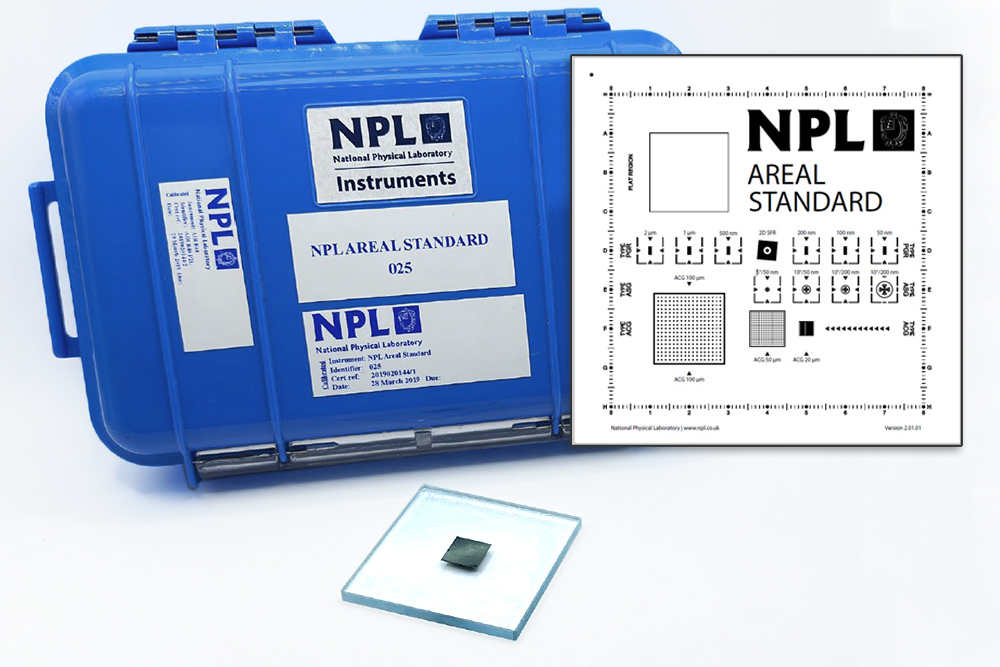
NPL Areal Standard
Multiple surface geometries including steps, grids and Siemens stars
Uses: Optical (3D) instrument testing
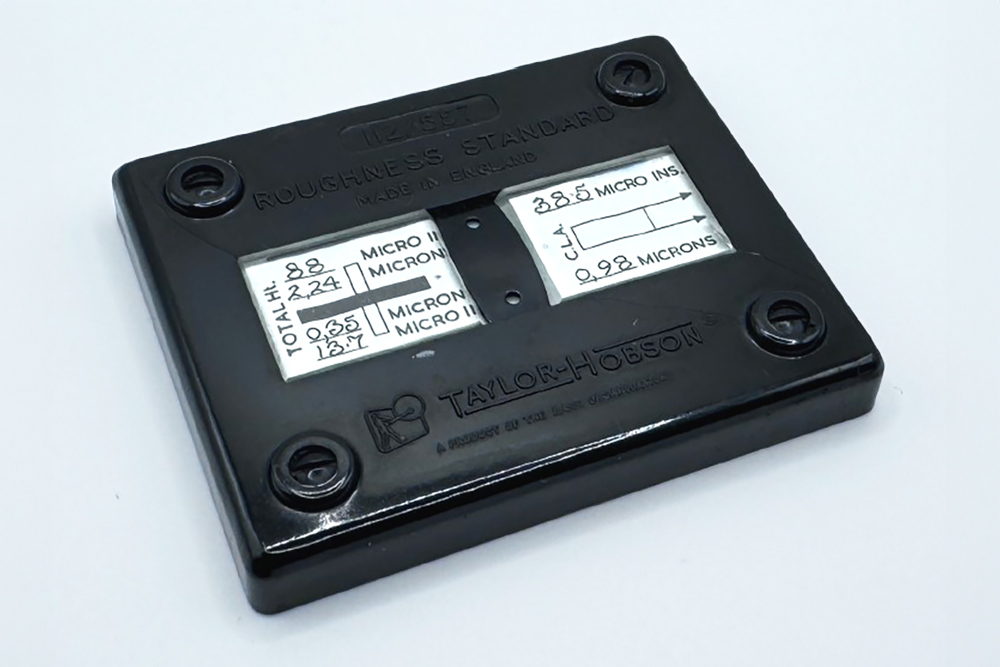
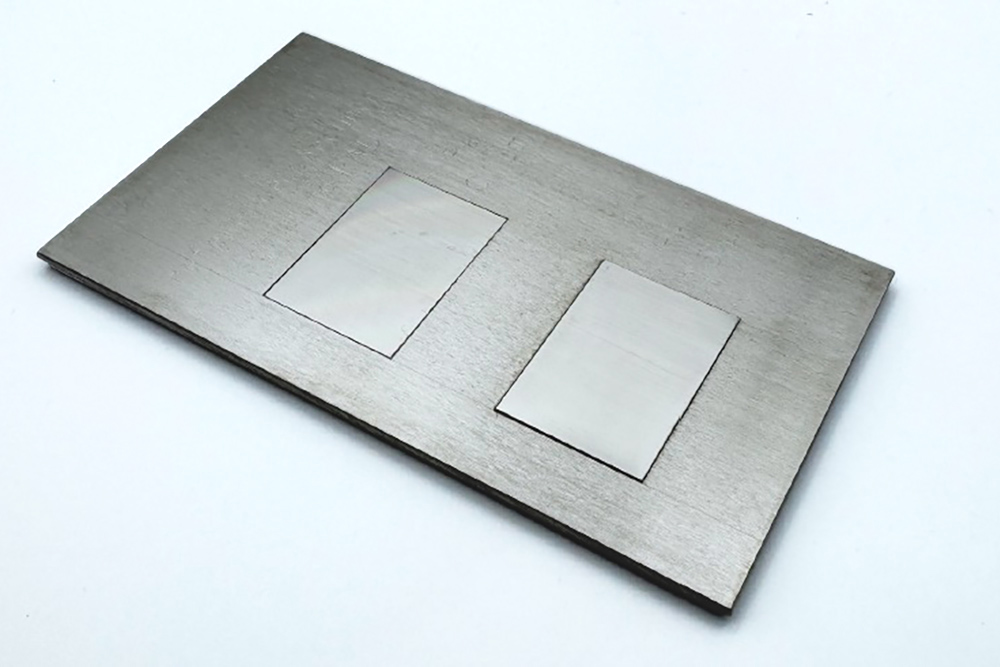
Taylor Hobson 3-Line and Roughness
Calibrated groove depths and triangular roughness waveform in glass
Uses: Stylus (2D) and Optical (3D) testing
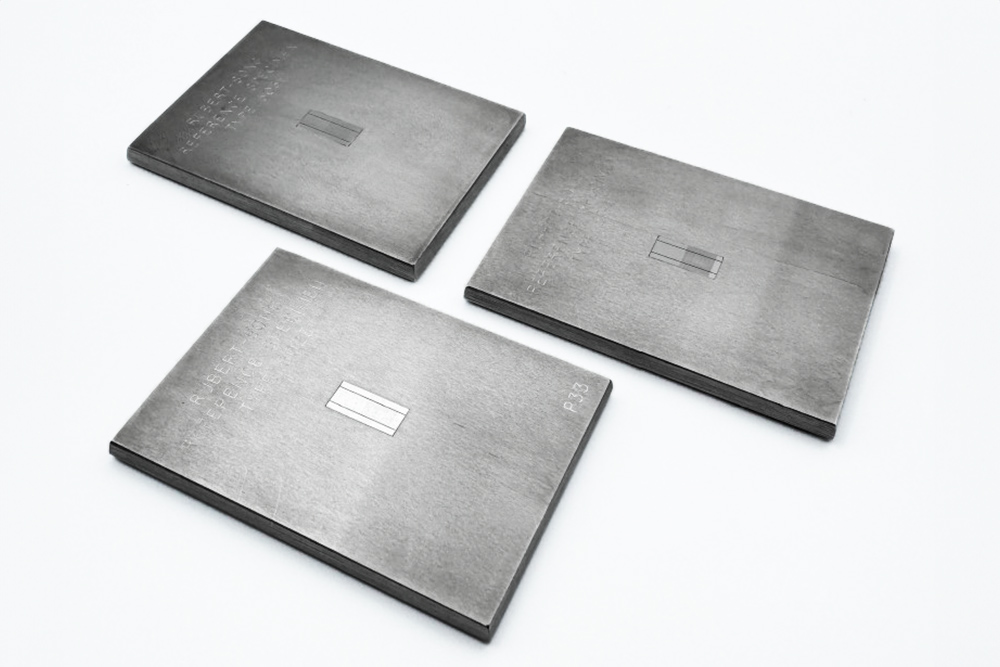
Rupert Type D Specimens
Type-D (random) texture. Nominal Ra values: 0.03, 0.1, 0.25 μm
Uses: Stylus (2D) and Optical (3D) testing
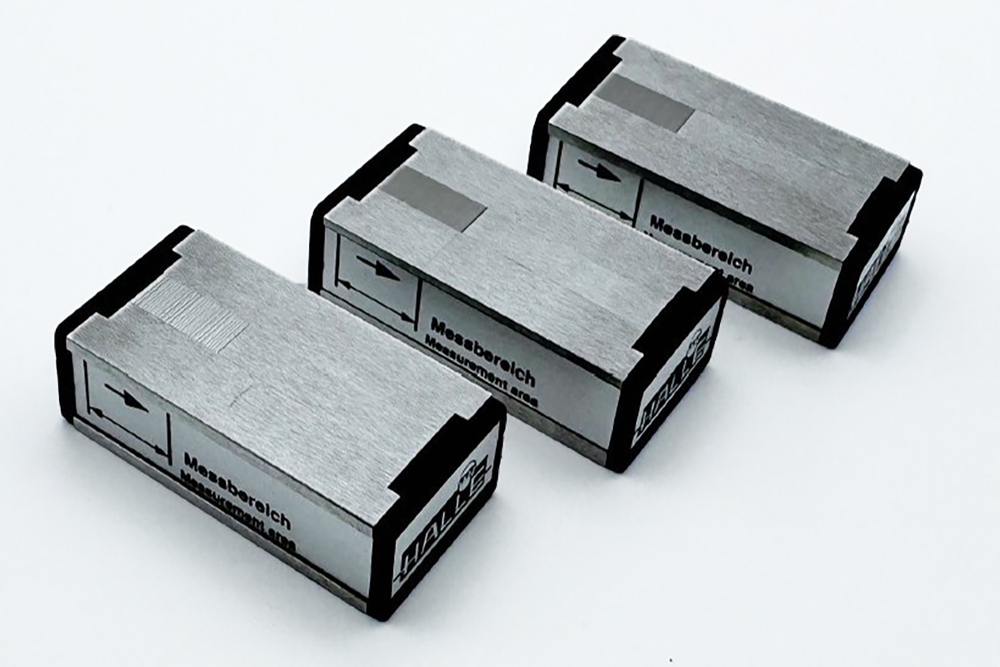
Halle Type D Specimens
Type-D (random) texture. Nominal Ra values: 0.2, 0.5, 1.5 μm
Uses: Stylus (2D) and Optical (3D) testing
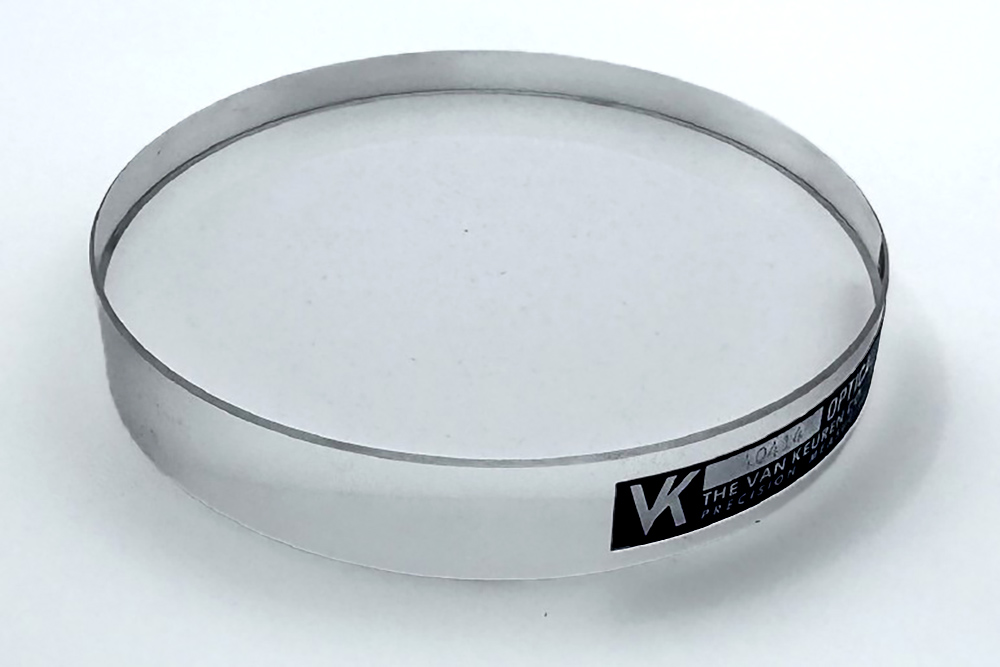
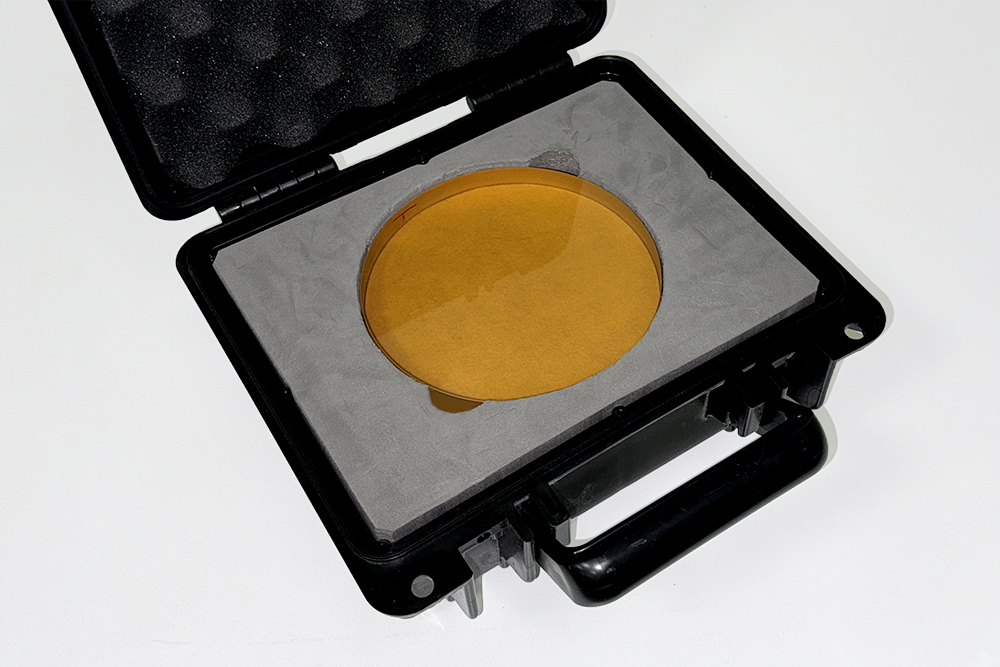
Optical Flats
Various sizes
Uses: Stylus (2D) and Optical (3D) testing.
“Chirp” Specimens
Chirp waveform for lateral resolution and slope sensitivity evaluation
Uses: Stylus (2D) and Optical (3D) testing
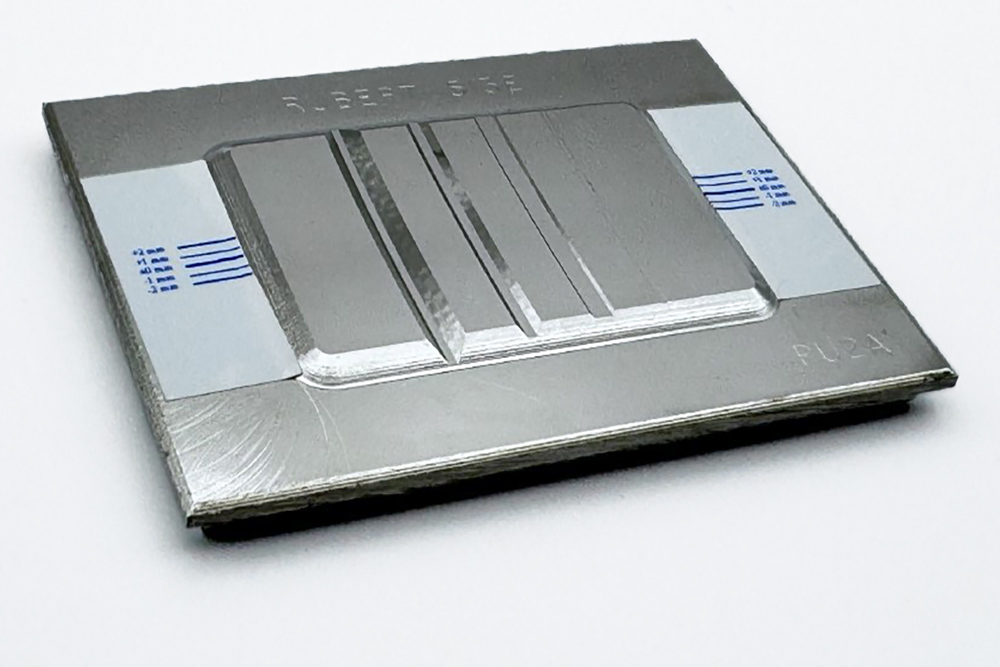
Rubert 513 Specimen
Calibrated groove depths
Uses: Stylus (2D) and Optical (3D) testing
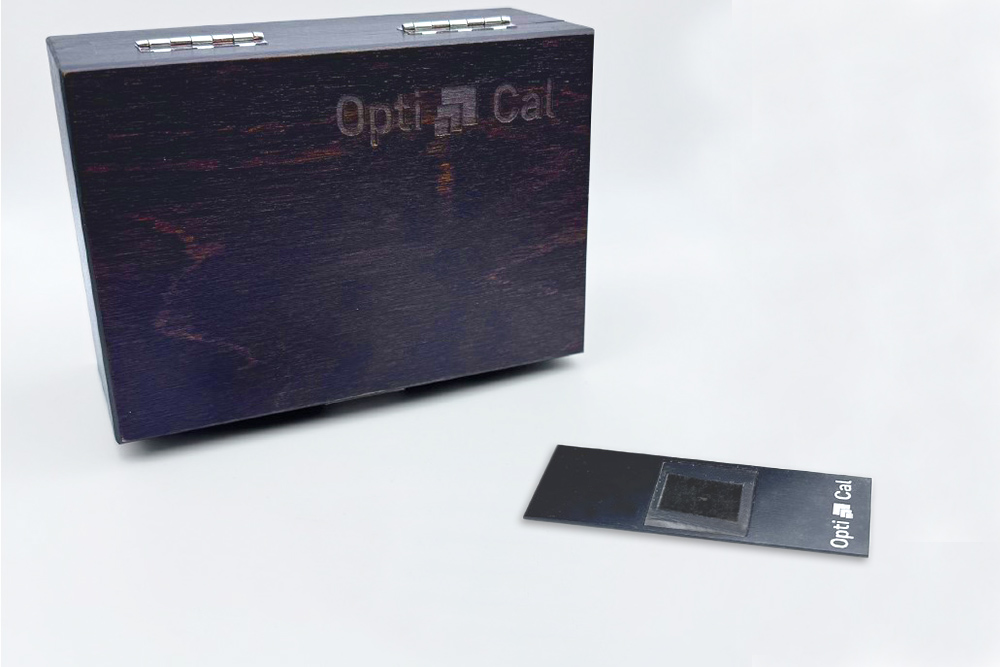
Opti-Cal Areal Standard
Multiple surface geometries including chirps, concentric circles, 3D-Type D and Siemens stars
Uses: Optical (3D) testing

Halle Type-D Specimens
Technovit 3040 replicated Halle Type-D specimens exhibiting microporosity with roughness values ranging from Ra: 0.5-1.5 μm.
Stylus (2D) and Optical (3D) testing
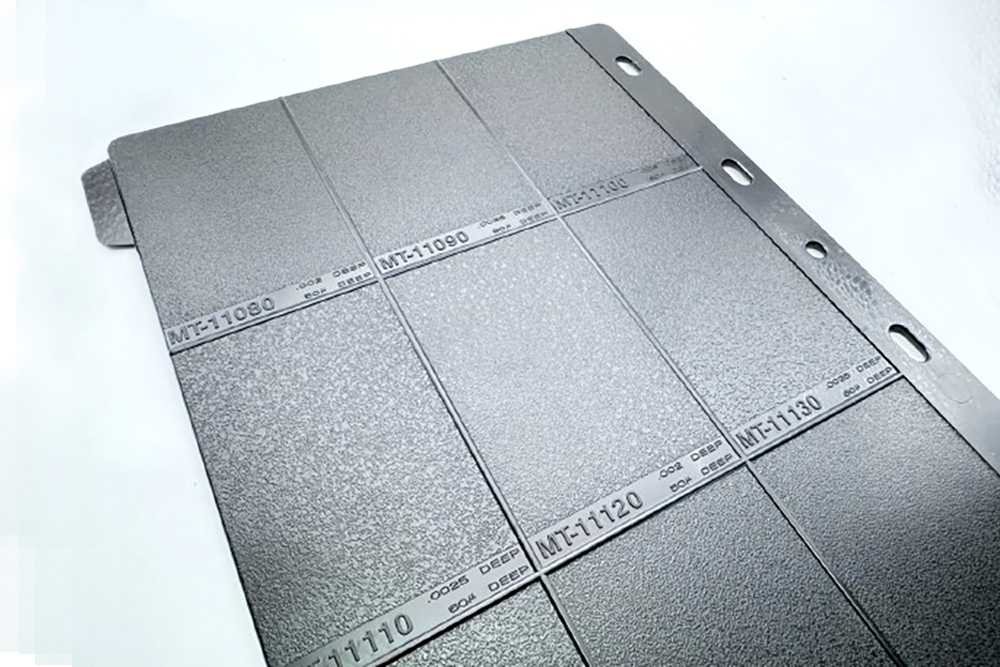
MoldTech Roughness Comparators
Plastic surfaces for visual, optical and stylus-based measurements. 90 different textures of varying roughness and geometry
Uses: Surface comparison
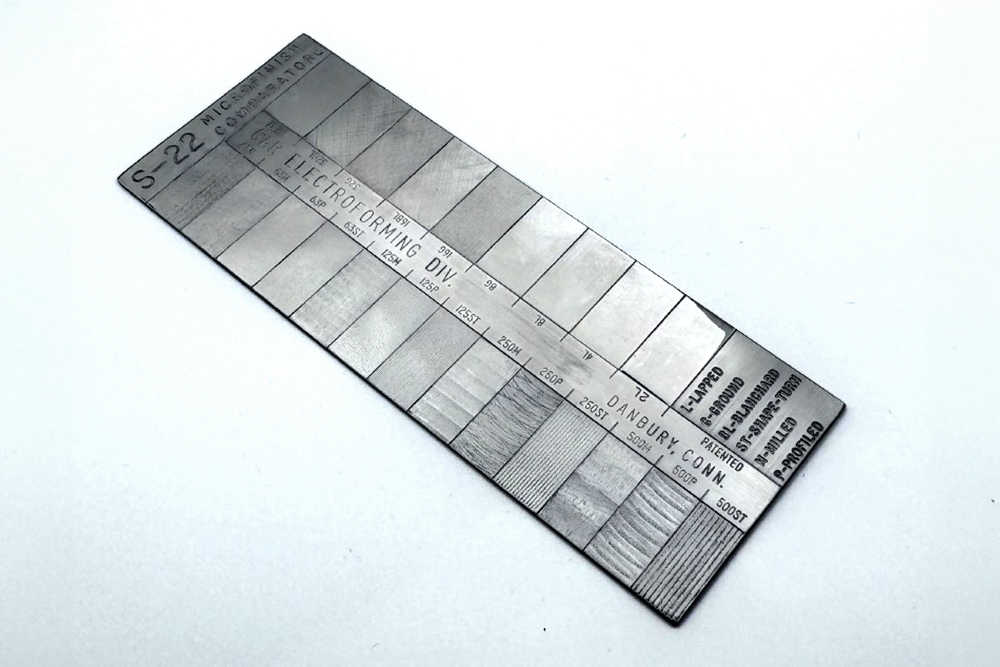
GAR S-22 Roughness Comparator
Comparator surfaces representing various manufacturing processes. For visual, optical and stylus-based measurements
Uses: Surface comparison
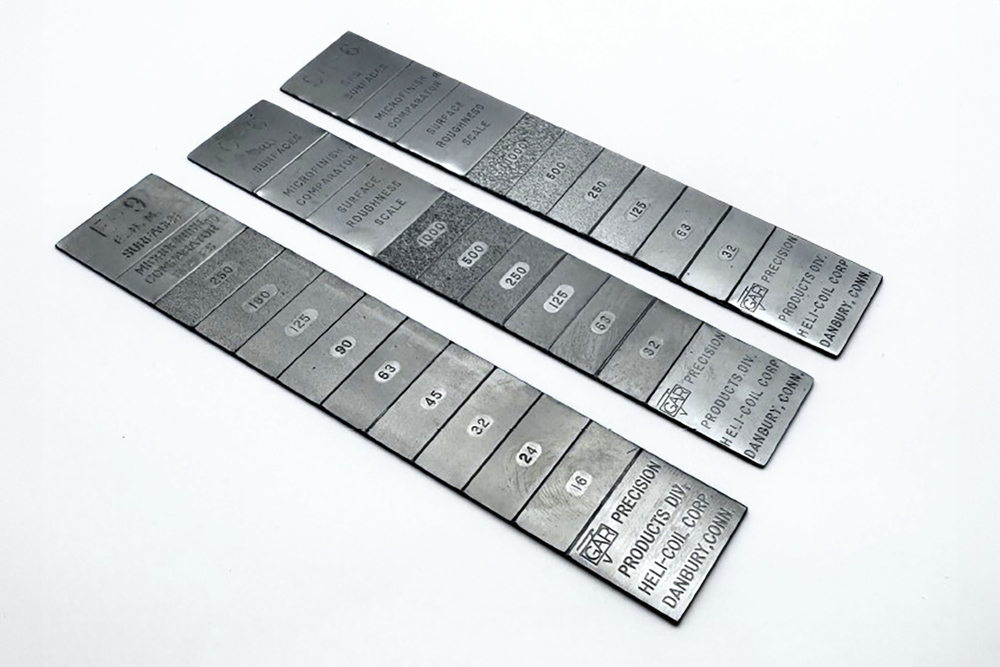
GAR Blasted and EDM Comparators
Comparator surfaces representing various manufacturing processes. For visual, optical and stylus-based measurements
Uses: Surface comparison
Rubert 589 Specimen
Two surface specimen containing a Rubert 528 Sinusoid (Ra 0.5 μm) and a 529 Sinusoid (Ra 0.1 μm)
Uses: Stylus (2D) and Optical (3D) testing
Optical Flat
Axial runout and vertical straightness evaluation.
Uses: Roundness and cylindricity
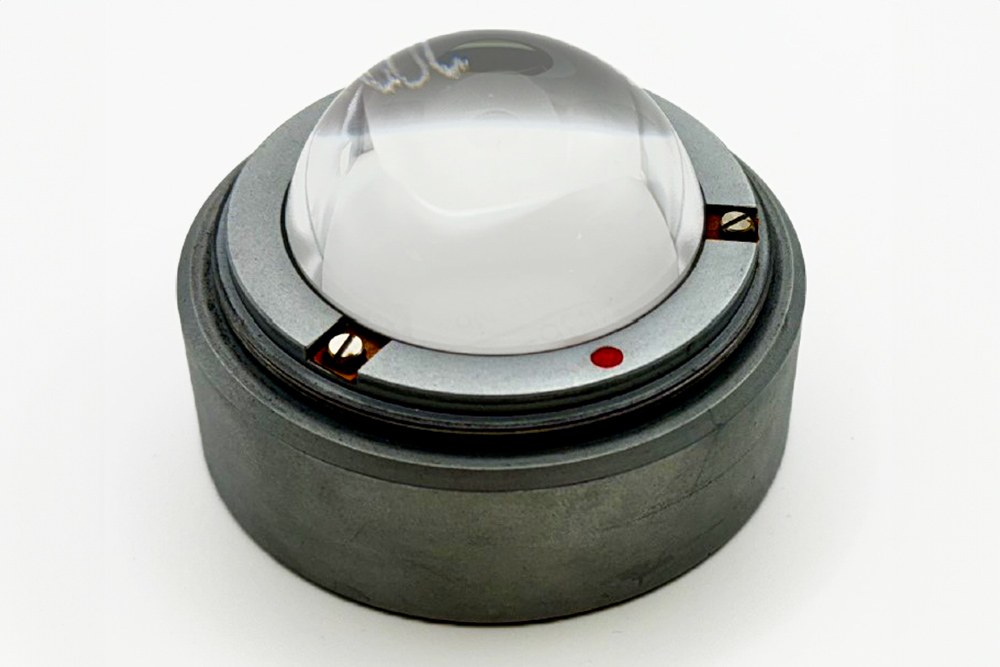
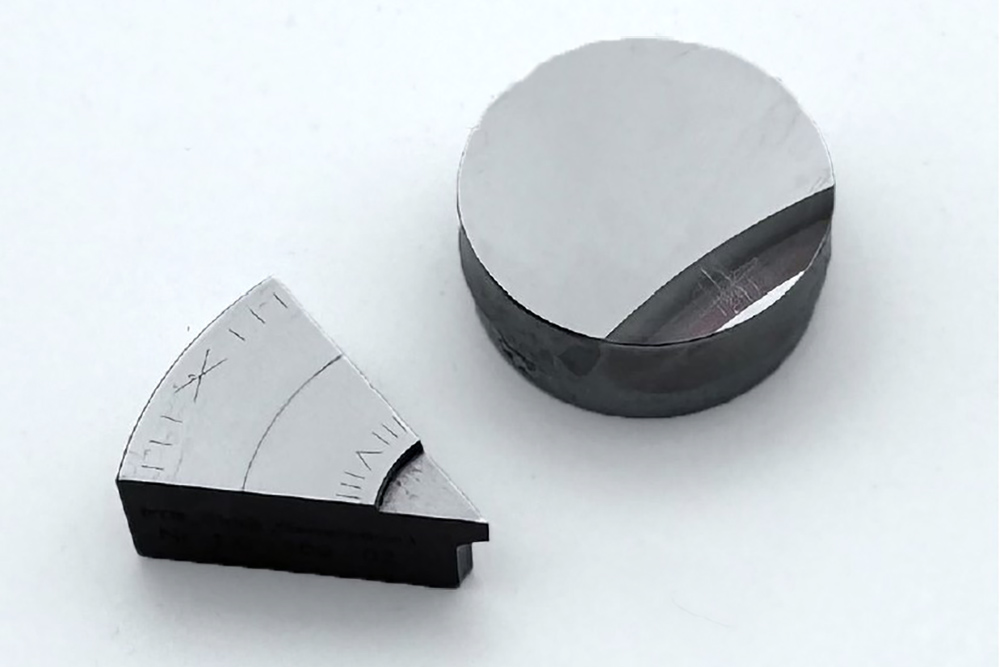
Precision Hemisphere
Axial and radial runout evaluation.
Uses: Roundness and cylindricity
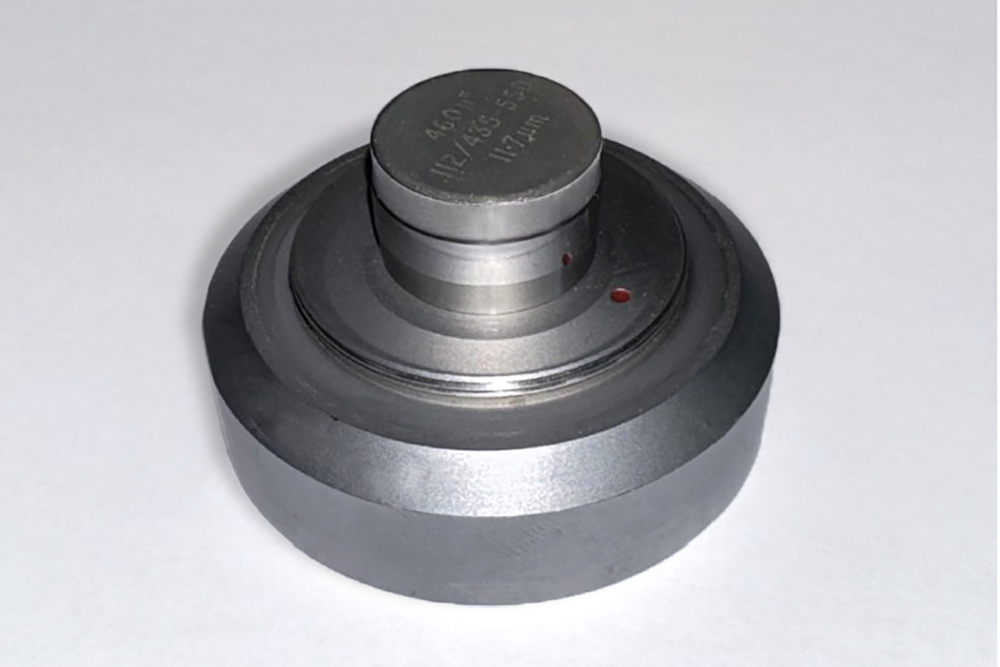
“Flick” Standard
Roundness calibration and gain verification
Uses: Roundness and cylindricity
How we test instruments
To compare instruments, we’ll typically take a series of measurements using all of the equipment under expected operating conditions. Then we’ll bring this data into a software package such as OmniSurf, OmniSurf3D, or OmniRound to give you an “apples to apples” comparison using controlled analysis settings. You’ll see the data, and you can even explore how these results apply to the analysis of your surfaces —all before making a big change or committing to a big purchase.
Our goal is to give you knowledge as well as unbiased data to help you make decisions about measurement equipment and methods.
Training is part of the equation
Our customers often combine an instrument testing session with a half or full day of training. We believe in empowering people to help them make informed decisions in the future as well.
Got a tough measurement or correlation question? Contact us today—we can help you get the data you need to make the best decisions.