
3 Steps to Understanding Surface Texture
October 19, 2023
If you are new to surface measurement, you may have a lot of questions. “I have a surface finish specification. Where do I begin? What do I need to know?” This tutorial is provided to help you get started.
Analyzing Surface Texture
Surface texture is made up of many “shapes.” We can describe the shapes as a spectrum of “wavelengths,” ranging from short wavelength features we call “roughness” to long wavelength shapes we call “waviness” and “form.”
Through surface texture measurement we try to describe these shapes in terms of numbers. However, seeing the profile as well as the numbers is often the key to really understanding what is happening with a surface. In the images below a raw profile is divided into its major components: longer wavelength waviness (top) and shorter wavelength roughness (bottom).
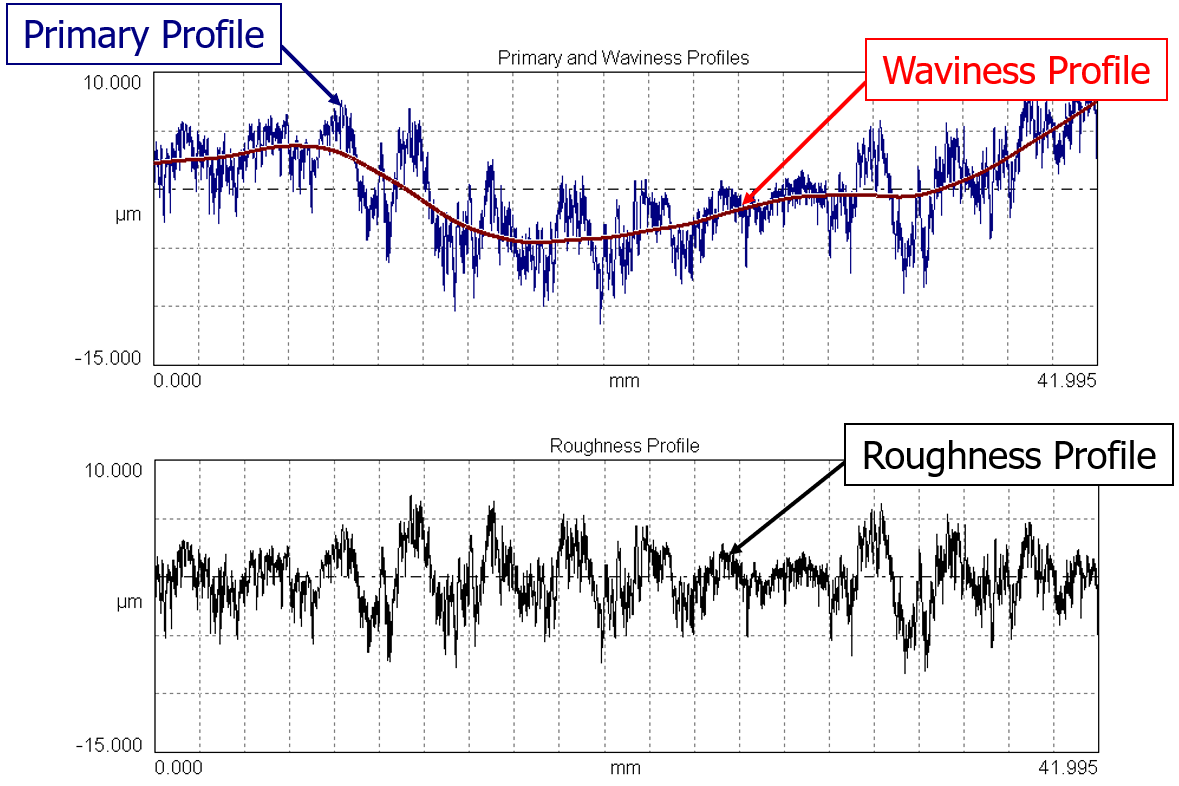
The blue profile in the top graph is referred to as the “primary” profile. It’s the raw profile after the very shortest wavelengths have been filtered out.
In general, “surface texture” refers to the primary profile, roughness, waviness, and other surface attributes such as the direction (“lay”) of the surface features. The term “surface finish” typically refers to the “roughness” aspects of the surface—ignoring the shape and underlying waviness. Be careful when dealing with only the “surface finish” as many functional problems are related to waviness as well.
How do we get these profiles from a raw measurement?
Surface measurement can be understood through the use of 3 fundamental topics:
- Fitting
- Filtering
- Analysis.
Fitting
The first step in analyzing surface texture is removing the underlying shape, or “form,” of the surface. In many cases, the surface is tilted relative to the measuring device. In other cases, the surface may be nominally curved. In both instances, that underlying geometry must be removed so that we can see the finer surface details without them being dominated by this much larger shape. We do this by “fitting” a geometric reference such as a line or an arc and then looking at how much the surface deviates above and below the reference geometry (the “residuals”).
The image below shows the raw data from a measurement system in the top (gray) profile. Superimposed on the raw data is the least squares fit line, which is used to remove the tilt from the profile. The residuals (above and below the line) make up the blue (primary) profile.
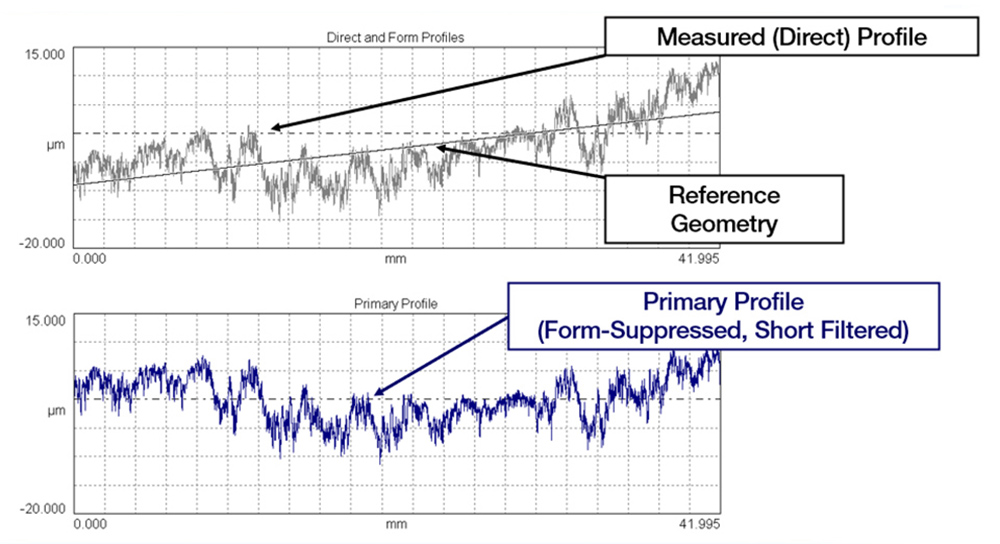
Note: a “short wavelength filter” is often used to remove noise from the primary profile and to further control the wavelength domain for roughness.
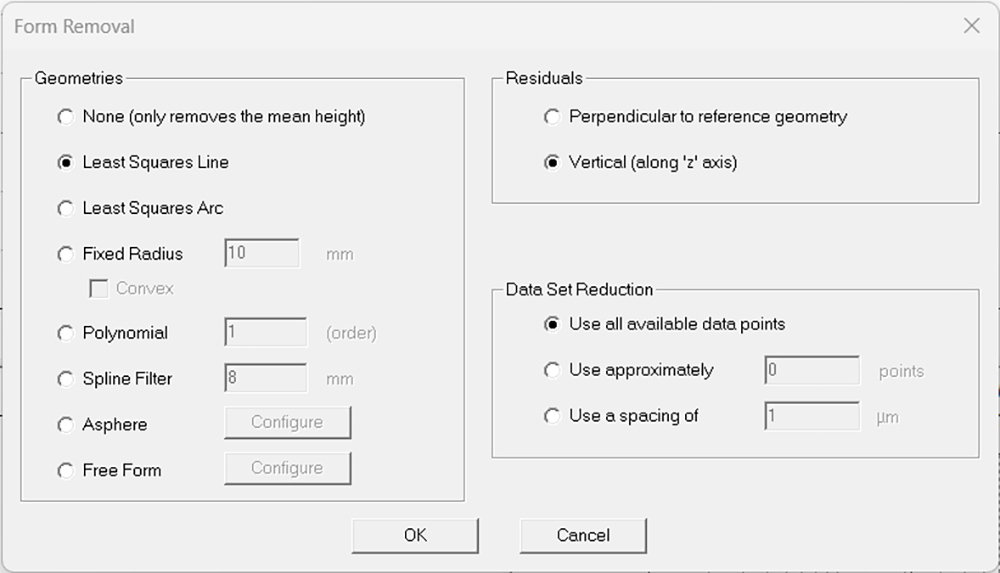
In Digital Metrology’s OmniSurf software, the settings for removing overall shape are found under Analysis > Form Removal. You can see the standard set of shapes on the left, and a few advanced settings on the right side of this dialog box.
2. Filtering
Once the geometry has been removed, we need to separate the longer wavelength waviness and the shorter wavelength roughness. This is the most critical aspect of surface measurement, and yet it is very often misunderstood.
Filtering surface profiles involves running a “smoothing” filter through the primary data. The amount of smoothing is based on a “filter cutoff wavelength,” which separates roughness from waviness. Shorter wavelengths fall into the roughness profile and longer wavelengths appear in the waviness profile.
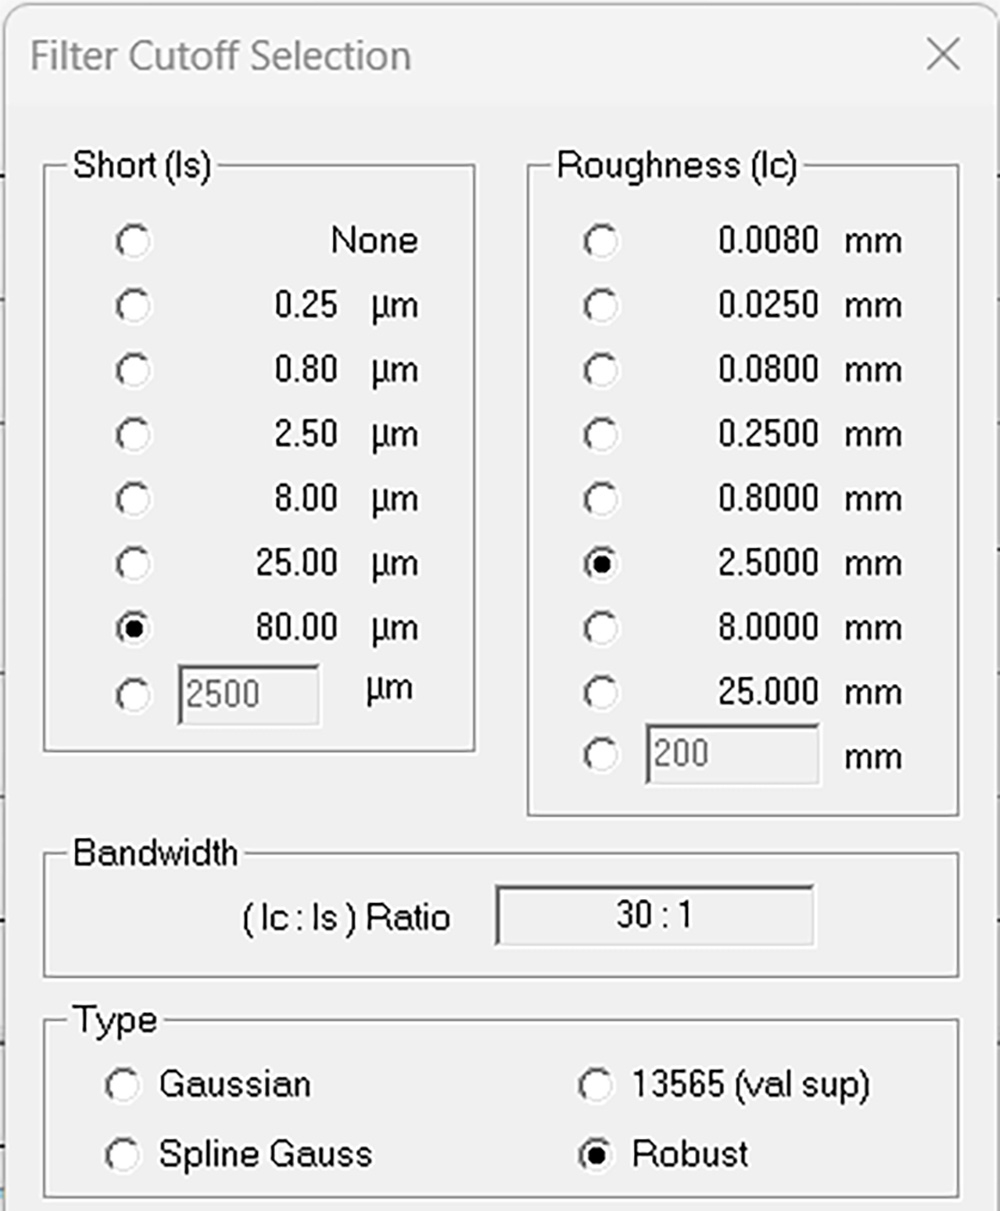
The filtering settings in OmniSurf are found under Analysis > Filtering. On the left are the settings for the Short Filter Cutoff wavelength (designated λs), which removes the shortest wavelengths from the primary profile. On the right are the settings for the Roughness Filter Cutoff wavelength (designated λc), which separates the roughness from waviness.
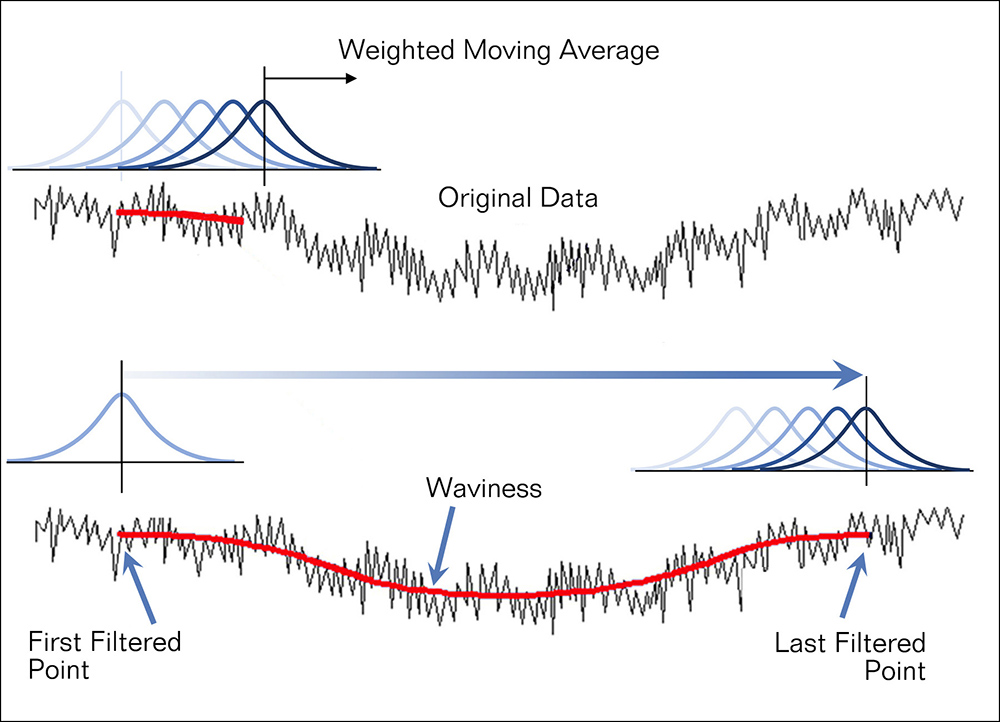
A “Gaussian” type filter is recommended in ASME and ISO standards. The Gaussian filter is based on passing a Gaussian, weighted average through the primary profile—resulting in the waviness profile, as in the image below. The roughness profile is made up of all of the peaks and valleys (residuals) above and below the waviness profile.
The filter cutoff defines what will be called roughness and what will be called waviness. We don’t have standard wavelengths that are considered roughness or waviness—the choice is entirely dependent on the application. The shapes that we would consider roughness and waviness on a precision optical surface might be different than those that we would analyze on a turned metal surface. The application drives the choice of cutoff wavelengths.
Changing the roughness filter cutoff wavelength changes the amount of “averaging” and “smoothing,” which can have a huge impact on roughness and waviness measurements. Making the cutoff value larger will include more wavelengths in the roughness profile and less wavelengths in waviness. Making the roughness cutoff smaller will do the opposite, and it will result in smaller roughness values… even though the real surface could be very rough.
The image below shows how changing the roughness filter cutoff wavelength can lead to very different profiles. The roughness profile on the bottom left gives twice the “average roughness” (Ra) value of the profile on the bottom right. This is why specifications for surface roughness parameters must include the intended short and roughness cutoff wavelengths. Without them, the specification is essentially meaningless!
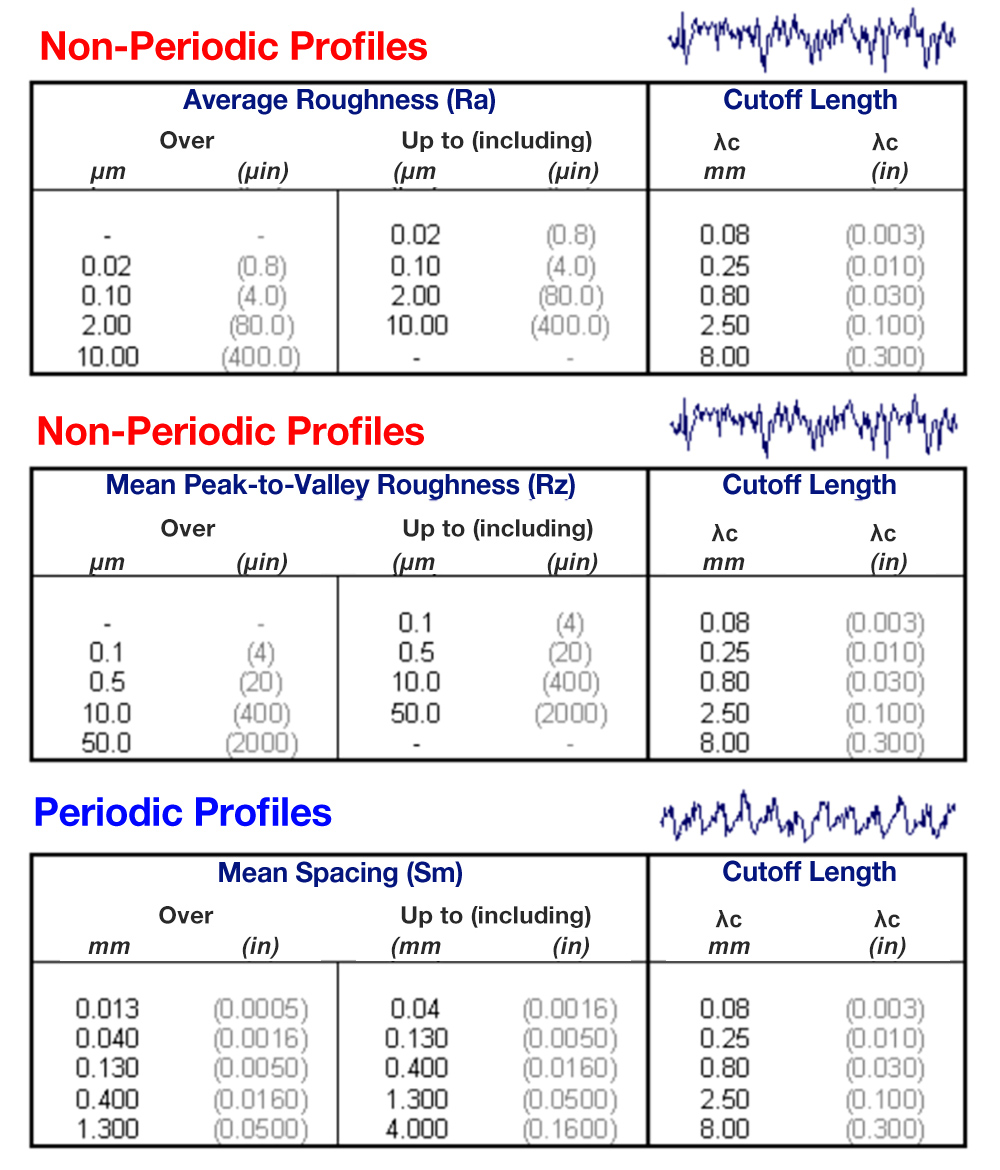
Surface roughness standards such as ASME B46.1-2002 and ISO 4288-1996 standards include tables of “standard” cutoff values, as well as recommendations for how to select the appropriate cutoff wavelengths for a particular application.
3. Analysis
Once we’ve separated the data into roughness and waviness profiles, we can analyze the aspects of the texture that we care about. Numbers (parameters) provide one way to analyze the data and to track parts and processes over time. But operating by numbers alone is a lot like driving in the dark using only a compass and speedometer: you may get where you’re going, but you’ll have no way to react to changes along the way.
Surface texture analysis is really a combination of exploring the profiles and tracking the numbers. Software like OmniSurf and OmniSurf3D give you tools to do both. Rather than simply reading a value from a gauge and making sure it matches a print, OmniSurf lets you see the surface texture, so when the numbers change you can understand the reasons why.
We’ve already looked at the profiles, so now let’s look at the parameters. There are a lot of ways to put numbers to the data. In OmniSurf you can choose from dozens of roughness parameters.
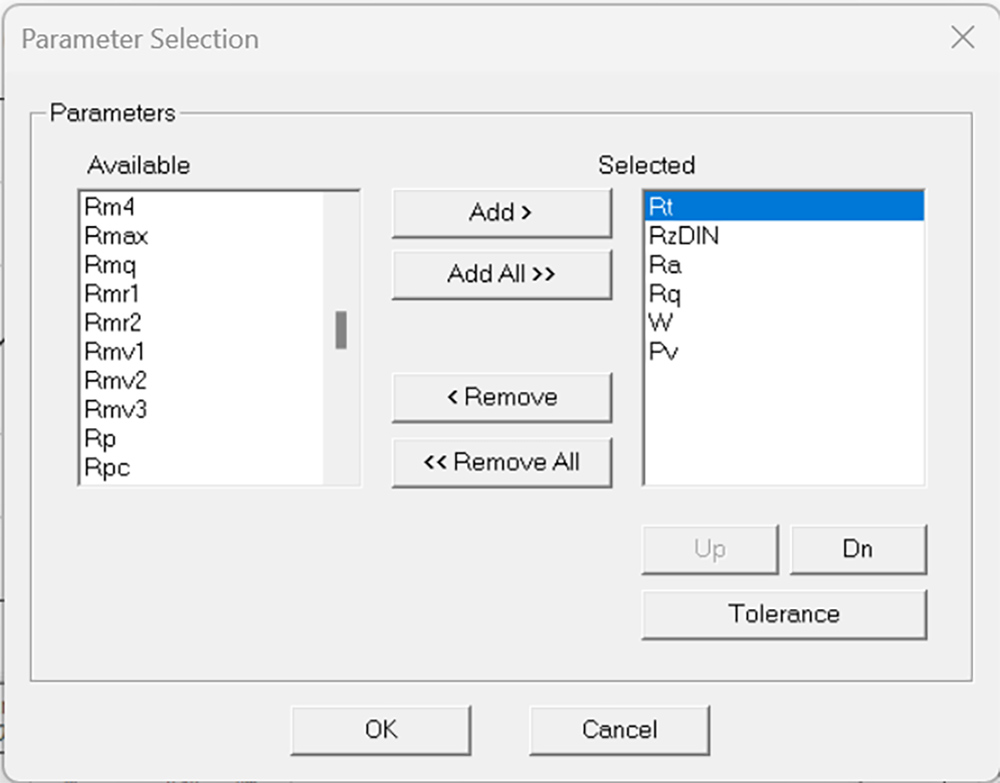
The simplest roughness parameter is the “total” height of a given profile. This is the “peak-to-valley” height of the profile. For the primary profile the total, peak-to-valley height is designated “Pt.” For the waviness profile it is “Wt” and for the roughness profile it is “Rt” (the first letter always designates the profile).
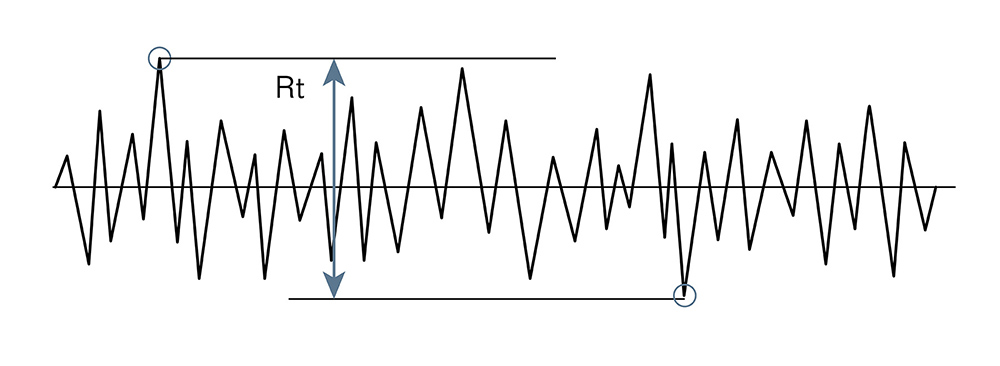
Unfortunately, the old adage “you get what you pay for” holds true here. The parameters, Pt and Rt are often quite unstable since they can be influenced by dirt, vibration and other things that are “outside the normal statistics” of the surface. On the other hand, the peak-to-valley waviness, Wt, is considerably more stable as it is based on only the long wavelengths and effects from dirt are “smoothed out.”
The most common roughness parameter is the average roughness, Ra. Many years ago, this parameter was referred to as the “arithmetic average” (AA) or the “centerline average” (CLA). Today we designate it “Ra” to be consistent with the rest of the roughness (“R”) parameters.
The average roughness (Ra) reports the “average distance between the surface and the meanline,” looking at all of the points along the profile.
For example, if a surface has heights and depths as follows, it will give an Ra value of 3.33 (in units of height such as microinches or micrometers):
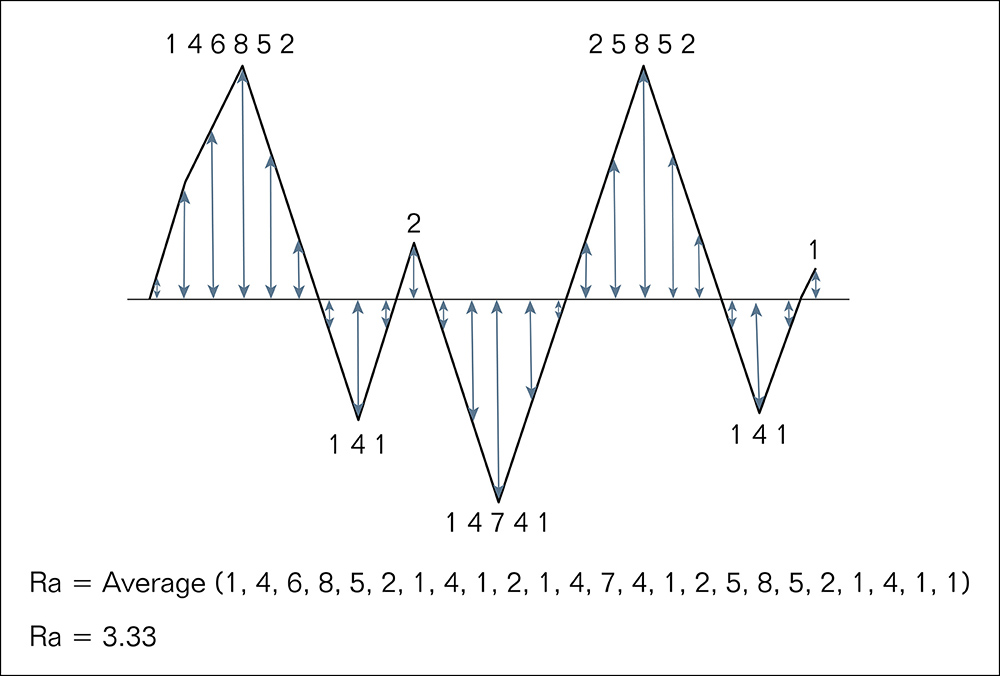
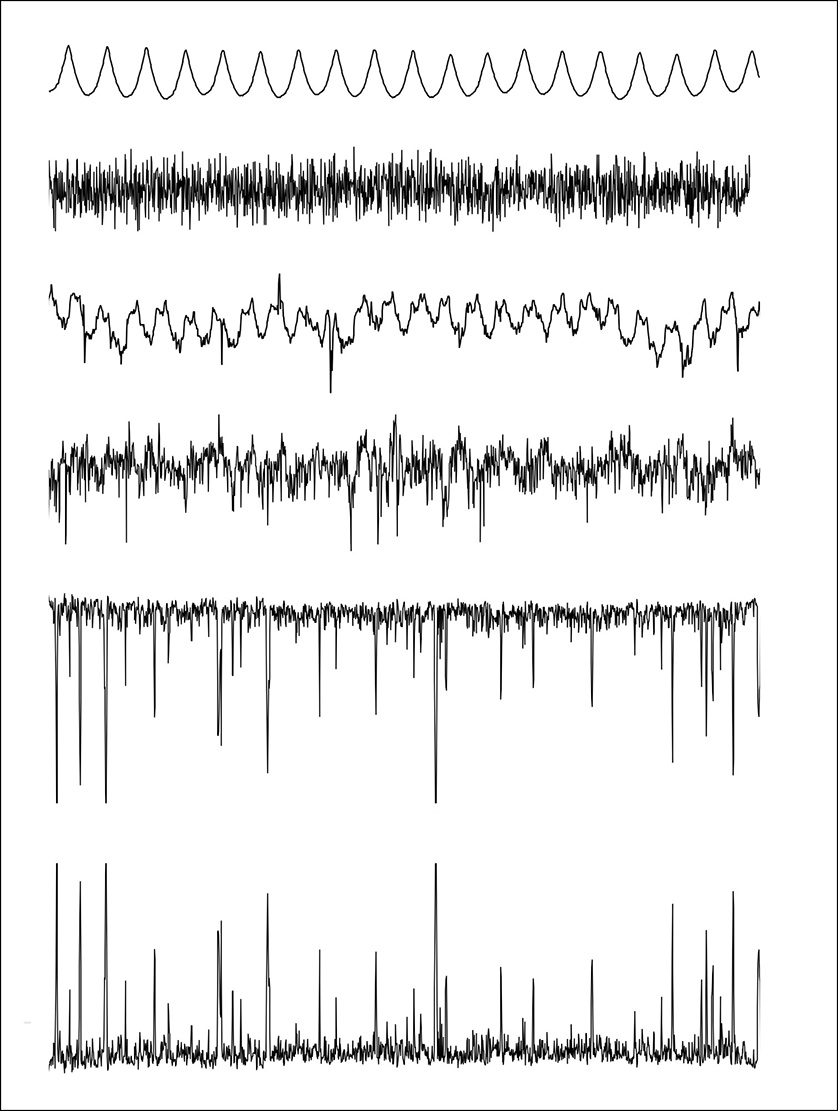
Since the average roughness (Ra) is simply the “average distance” from the meanline, peaks and valleys are treated the same way. So, very different profiles can all have the same Ra value, as shown in the image below:
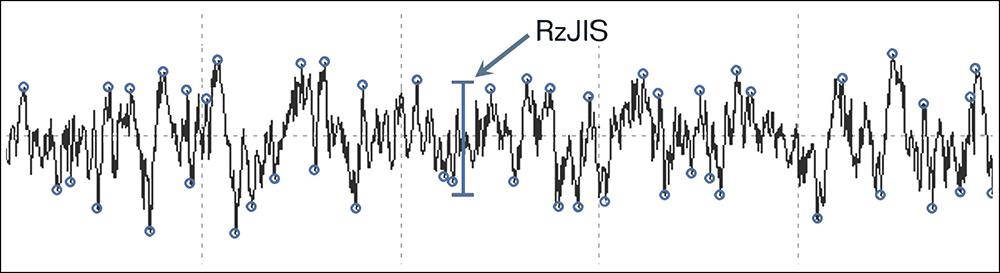
Second to Ra in terms of popularity is the “average peak-to-valley roughness” or “ten-point roughness,” designated Rz. Rz has different definitions based on the standard that you are working with. There are two basic definitions: one used in German (DIN) standards (and in today’s ASME and ISO standards), and one used in Japanese (JIS) standards (and older ASME and ISO standards). The DIN approach uses one peak and one valley in each sampling length, while the JIS approach uses 5 peaks and 5 valleys in each sampling length (“Sampling length” is the portion of the measurement used for calculating parameters such as Rz, Rpm, or Rvm). As a result, the DIN values are always equal to or higher than the JIS values. Be sure that you know which one you are using!
Rz (JIS, ASME pre-1995, ISO pre-1995)
Rz DIN, ASME 1995+, ISO 1995+)

There is a lot more to talk about. That’s why Digital Metrology offers on-site training for surface texture specification, measurement, and analysis. Contact Digital Metrology Solutions today.
We also invite you to use the many resources that we have on this site, including videos, blog posts, books, sample data, tutorials, and much more!