
Specification and Measurement of Plateau Honed Surfaces
A cylinder bore is one of the most engineered surfaces in the world—and its surface texture is one of the biggest levers for improving engine performance. The bore’s surface texture is optimized for performance and durability, and parameters and processes have been developed to improve efficiency, gas consumption, emissions, and wear.
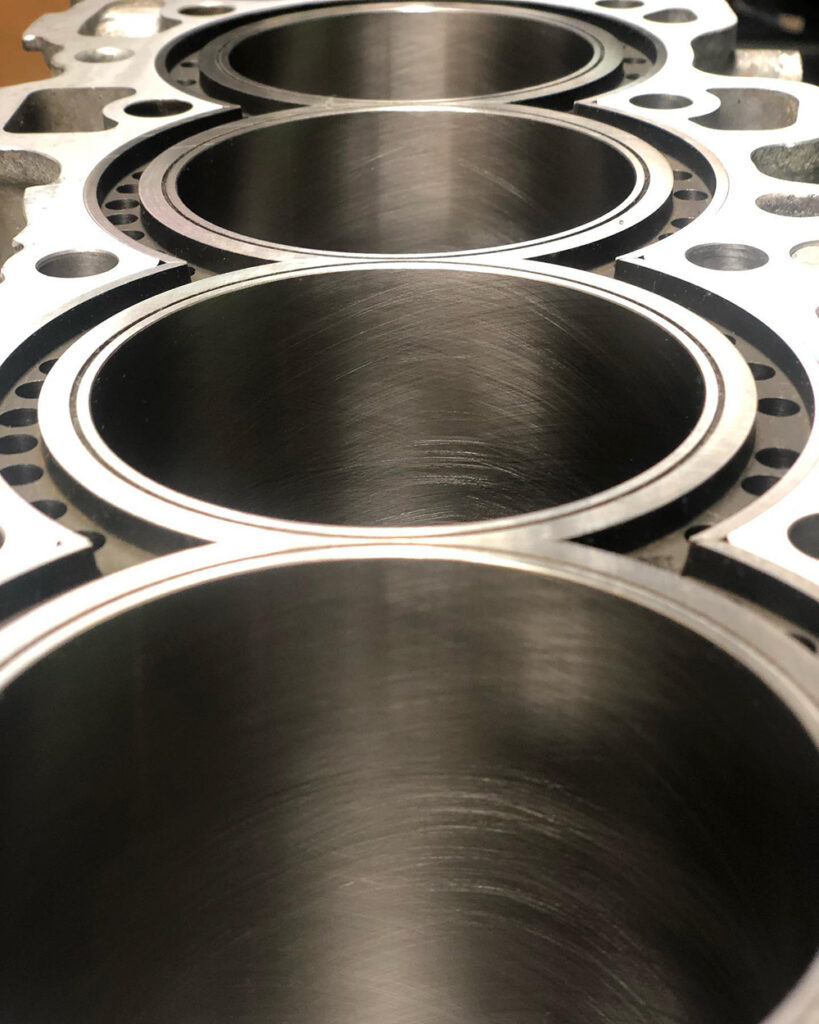
Cylinder bore surface texture. Courtesy QMP Racing.
An engine’s cylinder bore surface is designed to perform a balance between two, often competing functions: a high degree of sealing, and a low degree of friction. To this end, a cylinder bore surface is typically “plateaued,” consisting of a smooth upper surface and deeper valleys.
Plateaued surface texture consisting of plateau and valley regions.
The plateau areas provide a durable sealing surface against the piston rings to contain combustion gases and prevent oil consumption. In addition, the plateaus are optimized to minimize friction.
The valleys are intended to retain lubrication and trap micro-debris that is created as the surface wears. There is some debate as to which of these is the dominant function, but few disagree that the valley structures are critical to performance and durability.
The design of a cylinder bore surface, then, must strike a balance between providing sufficient plateau material for sealing and load bearing, and sufficient valley regions to carry lubrication and debris.
Evolution of cylinder bore surfaces
One or more honing operations are used to develop a cylinder bore surface.
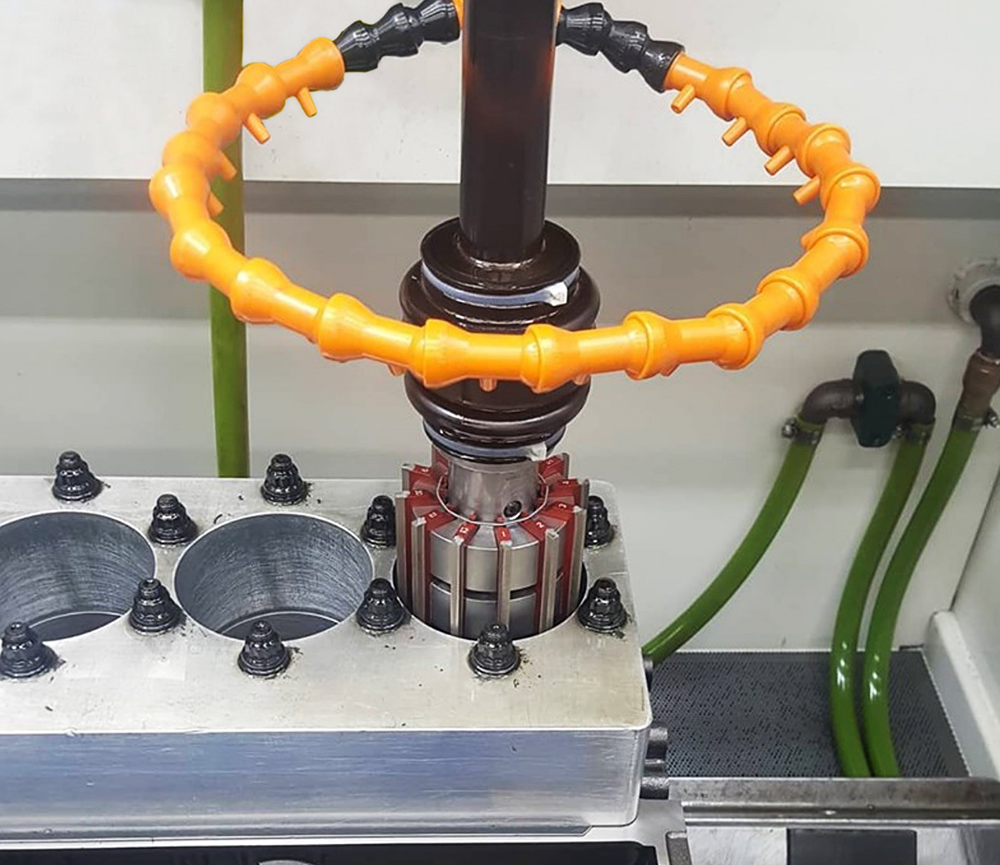
Cylinder bore honing process. Courtesy QMP Racing.
Historically, a plateaued surface was created by honing the cylinder once to create a single surface texture. The engine’s own action was then relied upon to “run in” or “break in” the surface, wearing away the peaks and leaving behind areas of “plateaus.”
Starting in the 1980s, concerns for fuel economy and emissions drove a stronger push for more efficient engines with tighter tolerances. This led to the development of processes to create the plateaued surface in the factory rather than waiting for the engine to do the work. After the first hone creates the valley structure, a second hone with a finer stone removes the peaks to leave behind plateaus.
High performance engines (racing, diesel, etc.) may require even more extreme honing to reach performance goals.
Profiles of these three types of surfaces are represented below.
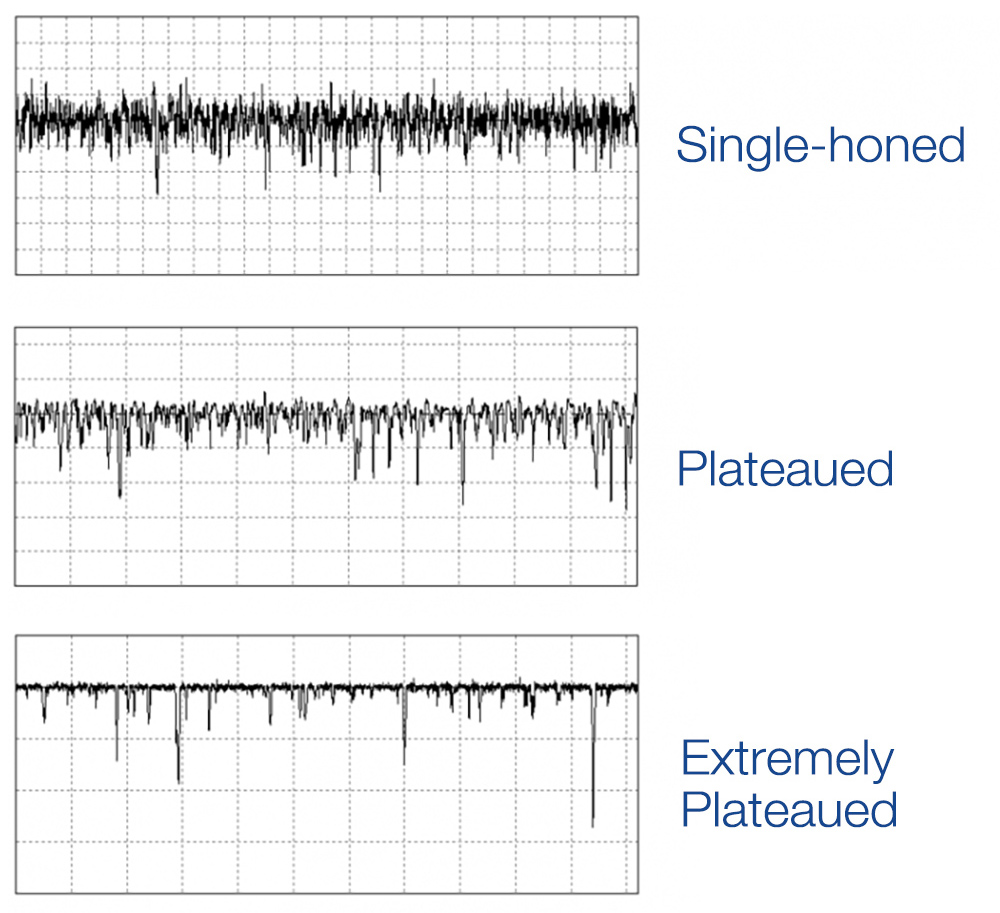
Three types of cylinder bore surface texture.
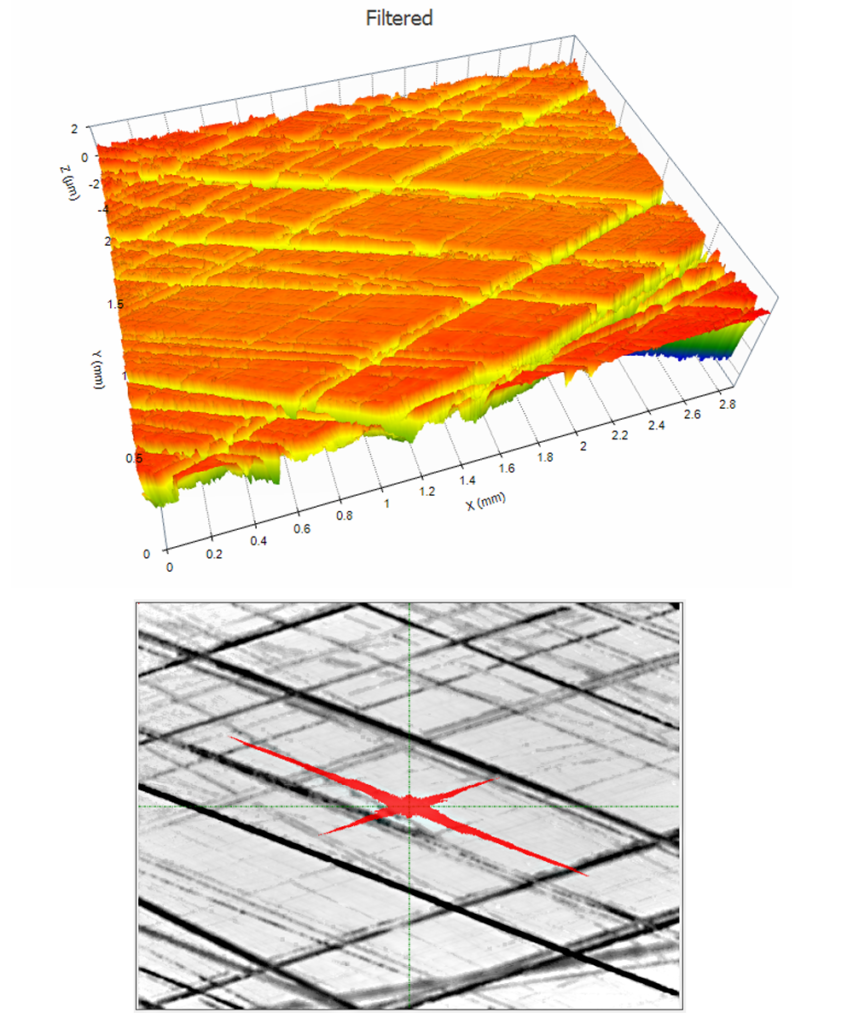
To control the honing processes, we need to monitor several aspects of the surface texture. We also need to monitor the crosshatch angle—the angle between the texture created by the hone as it passes down the bore, and back up the bore. To understand the surface, therefore, typically requires two types of data: profile data to show the heights of the surface texture, and some form of imaging to determine the crosshatch angle.
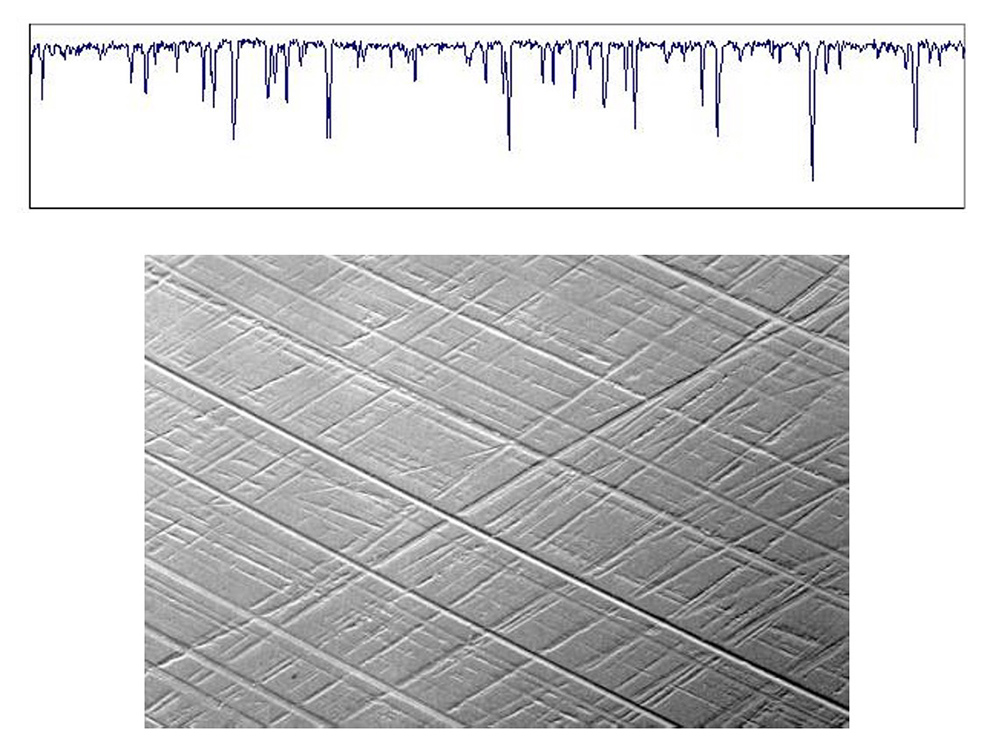
Profile and image data together make it possible to understand the surface texture and crosshatch angle.
Measuring the texture of plateaued surfaces
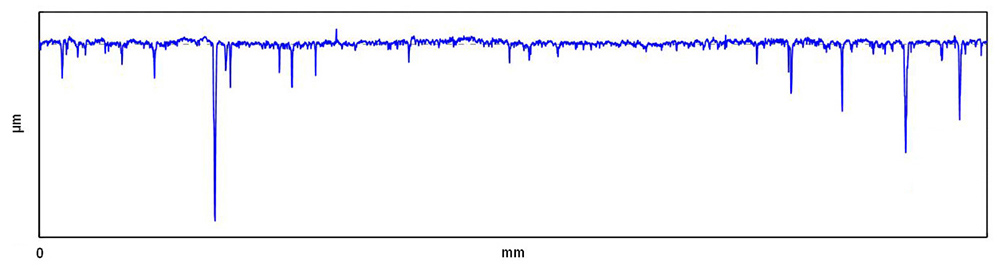
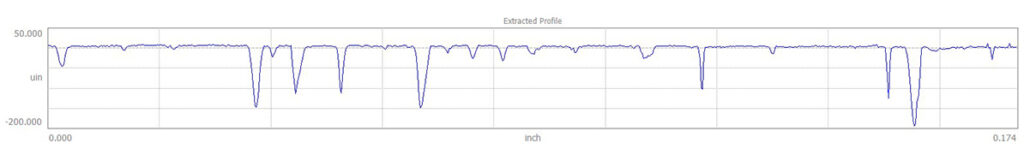
Most cylinder bore measurements are performed with a stylus-based roughness gauge. Optical measurement techniques are sometimes used for this application, but the cost, the complexity of tooling, and relatively long cycle times have limited their adoption. A stylus profile of a plateau honed surface is shown below.
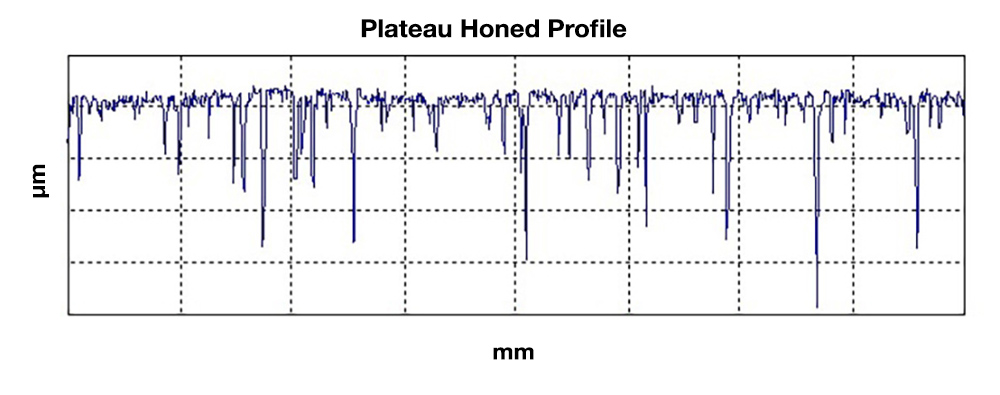
Plateau honed profile showing many deep valleys.
Looking at the profile above, it may seem impossible that a stylus tip, however sharp, could possibly enter and measure such narrow-looking valleys. But it’s important to note that the scale on profile data is grossly exaggerated in the vertical direction in order to show the shape of the texture—microns in the y axis vs millimeters in x. What appear to be sharp, narrow valleys in the profile above are actually more gradually sloped when scaled 1:1, as the image below shows. A 90-degree stylus tip will have no trouble tracing these valleys accurately.
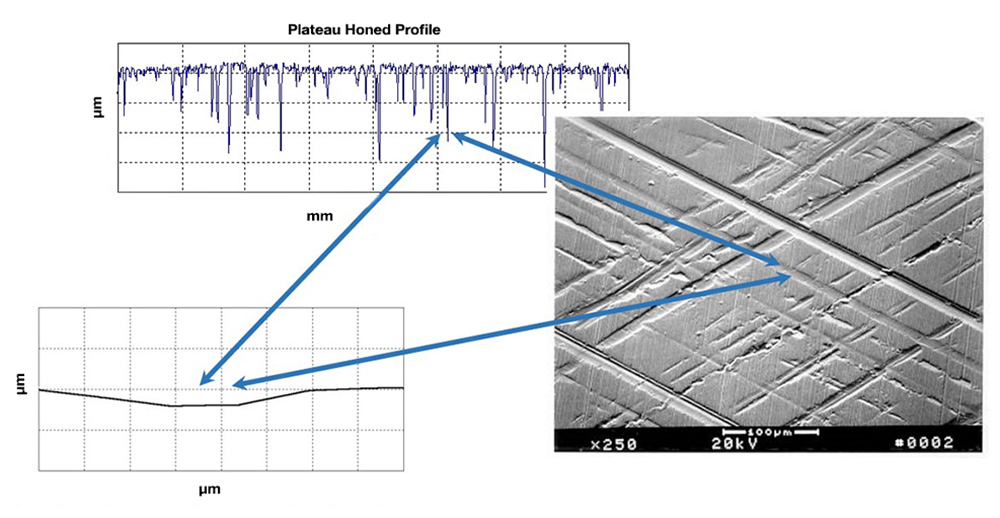
…but when displayed at 1:1 aspect ratio the valleys clearly can be traversed by a sharp stylus.
Types of stylus systems
There are two common types of stylus measurement systems: skidless and skidded.
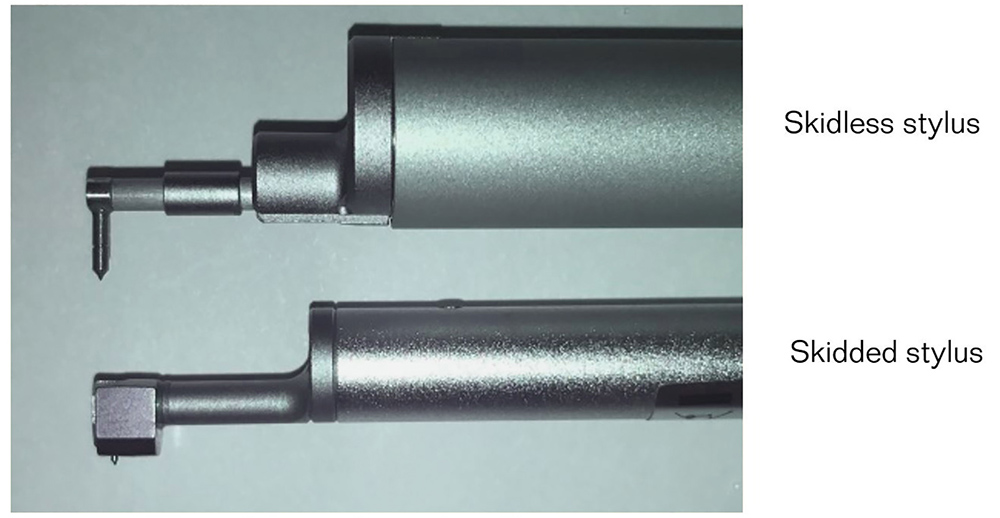
Skidless and skidded styli.
In a skidless system, a sharp stylus traces over the surface, capturing all wavelengths of the surface texture—form, waviness, and roughness. This method gives a very accurate representation of the surface; however, the stylus is exposed and more prone to damage. Skidless systems are also very sensitive to vibration and workpiece alignment, and they tend to be more expensive. All of these drawbacks tend to limit the use of skidless systems for production measurements.
In a skidded instrument, the measurement probe includes a radiused skid as well as the stylus. The skid follows the general shape of the surface while the stylus detects the roughness. Because of their robustness and ability to tolerate some level of vibration, skidded systems are by far the most commonly used for production cylinder bore measurements.
The effects of debris on stylus measurements
A very important consideration with stylus measurements in a cylinder bore is the sensitivity to debris on the measurement surface. When a stylus runs over a piece of dirt it measures it as a sharp spike. When the skid encounters debris it rises up and over the debris, causing the stylus to reach farther down. The stylus thus reports an artificially low region on the surface. In the image below, both the skid and the stylus pass over a piece of debris, creating both an artificial dip (from the skid) and a spike (from the stylus) in the data.
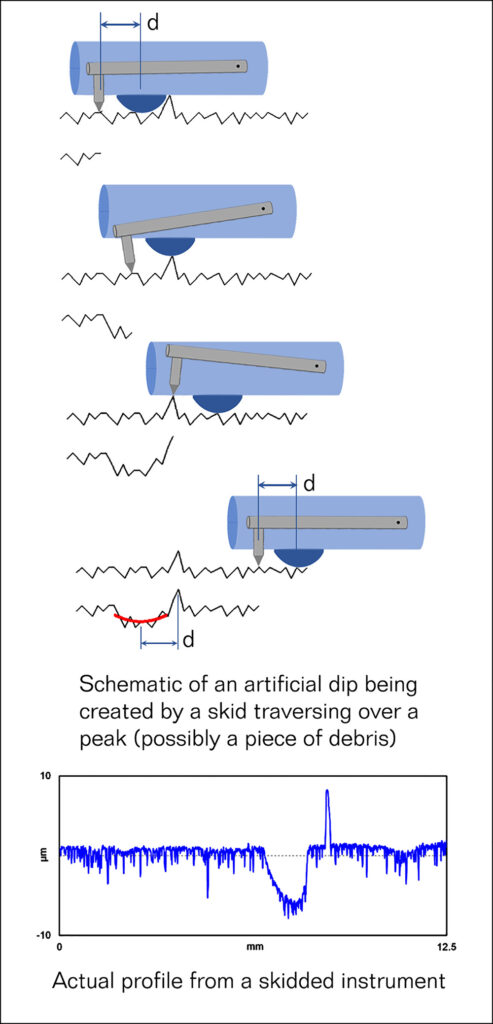
Errors caused by the stylus and skid passing over dirt. Courtesy The Surface Texture Answer Book.
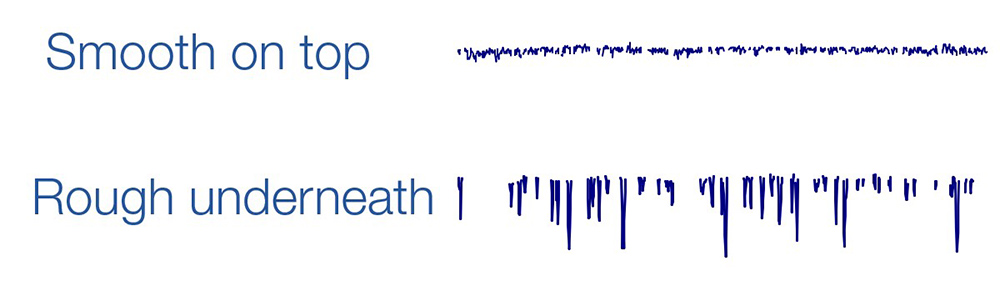
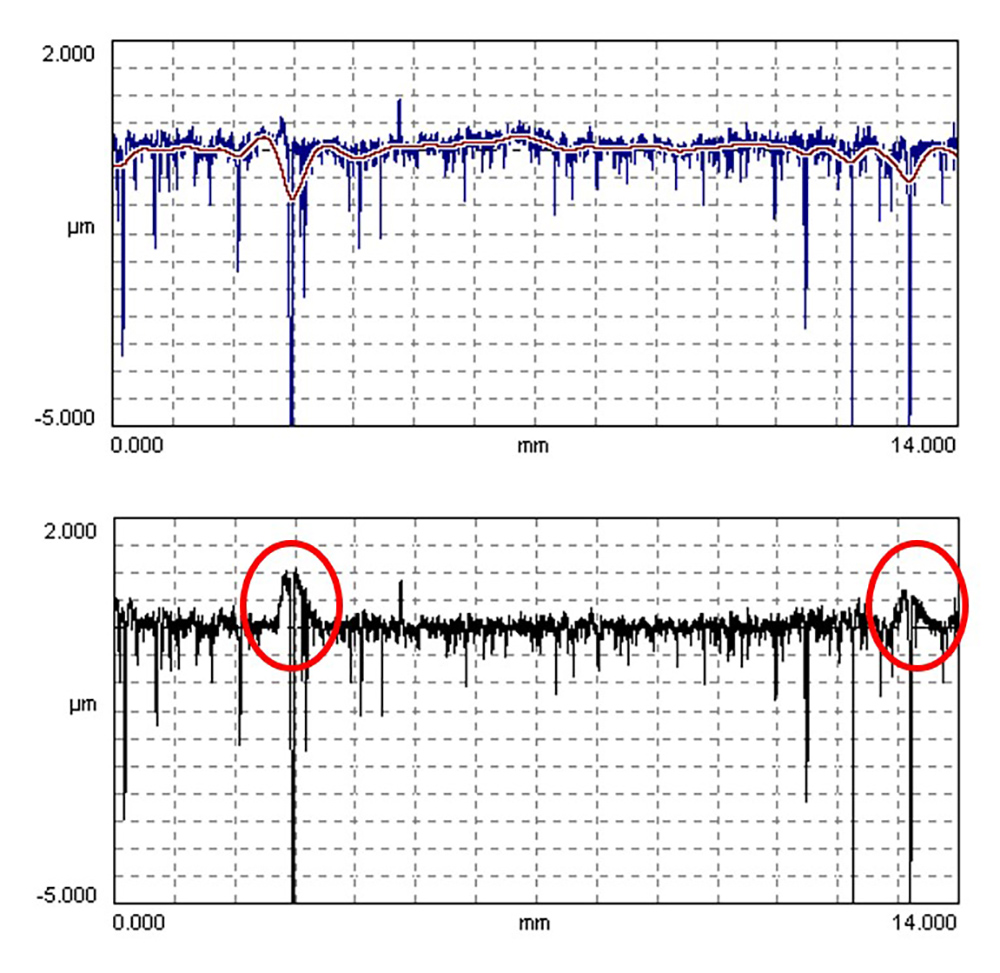
Because of its width, the skid will encounter debris much more frequently than the stylus. Thus, the upward “spike” is often not present, and we only see the “dip” resulting from the skid.
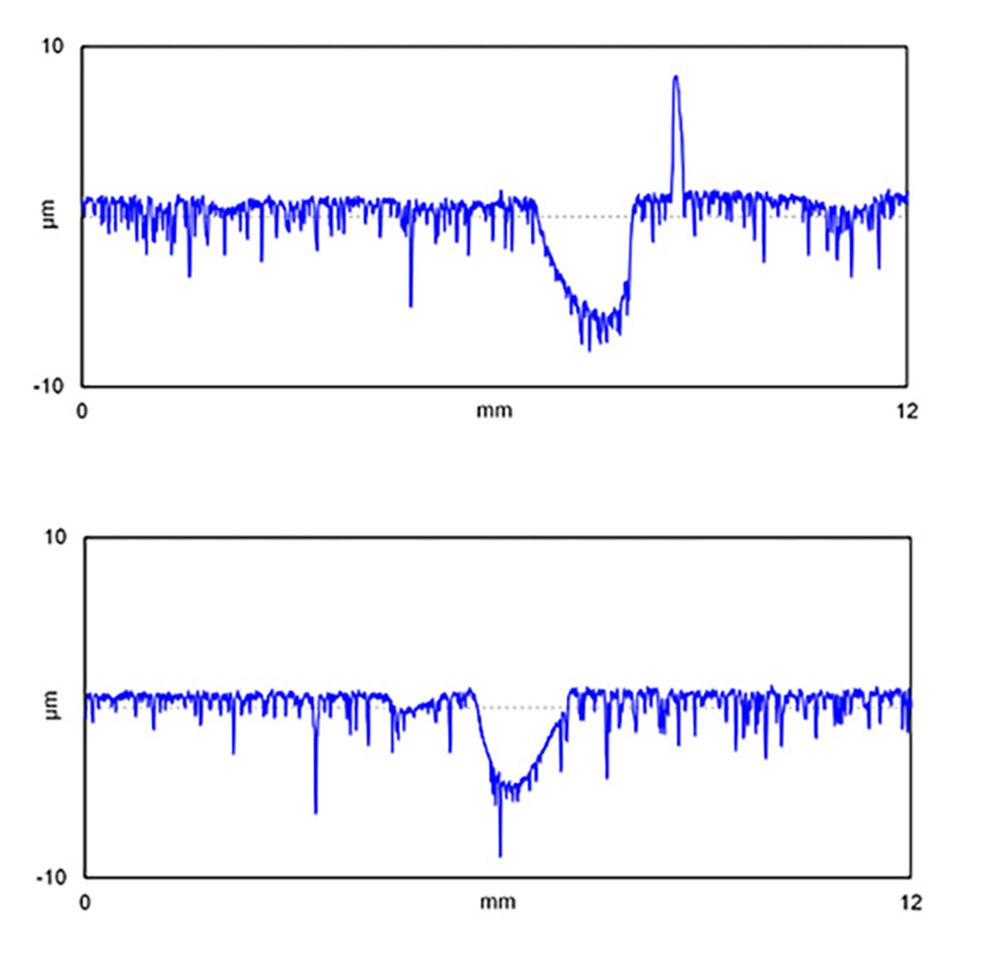
Error caused by the stylus and skid (above), and only the skid (below), passing over debris. Courtesy The Surface Texture Answer Book.
Both types of error can lead an incorrect analysis of the surface texture and roughness parameters While techniques have been developed to try to mathematically remove these errors from the data, all of the options create their own, secondary data errors.
The only reliable approach is to maintain a clean part surface, and to remeasure when errors like these occur.
Other measurement considerations
In addition to maintaining a clean part, to ensure good stylus measurements:
- make sure the stylus tip and traverse are in good condition
- maintain the instrument’s calibration
- verify that all settings in your software are consistent between measurements
- make sure fixturing is in good working order
- minimize vibration in the measurement environment.
Analyzing the surface texture
Extracting roughness data
Surface texture consists of a spectrum of spatial wavelengths, ranging from short-wavelength roughness through longer-wavelength waviness and form.
To isolate the roughness, we start with the raw profile from the measurement instrument. A short cutoff filter removes the shortest wavelengths (typically noise beyond the fidelity of the measurement system), which gives us the primary profile (the top profile in the image below).
We then apply a filter to the primary profile to create the waviness profile, which includes the wavelengths longer than the “roughness cutoff” wavelength. Waviness is shown as a red, undulating line through the data in the second profile, below.
Lastly, we subtract the waviness profile from the primary profile to obtain the roughness profile (bottom).
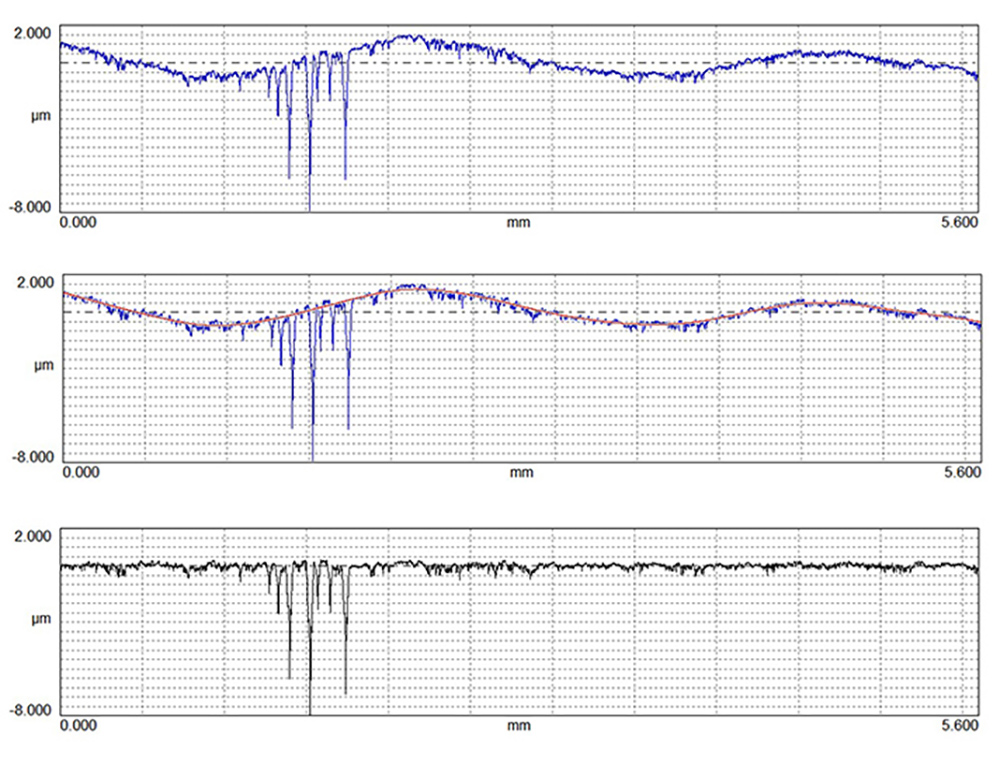
The primary profile (top) is filtered to create the waviness profile (red, center). Subtracting the waviness from the primary yields the roughness profile (bottom). Courtesy The Surface Texture Answer Book.
The choice of the roughness cutoff wavelength will greatly impact the roughness and waviness profiles. In the image below we see that applying a longer cutoff produces a smoother waviness curve with “higher” roughness (left). On the right, a shorter cutoff produces a bumpier waviness profile but a smoother roughness profile. When specifying and when reporting roughness values, the cutoff wavelength along with the short cutoff wavelength should always be stated in order to ensure equivalent results.
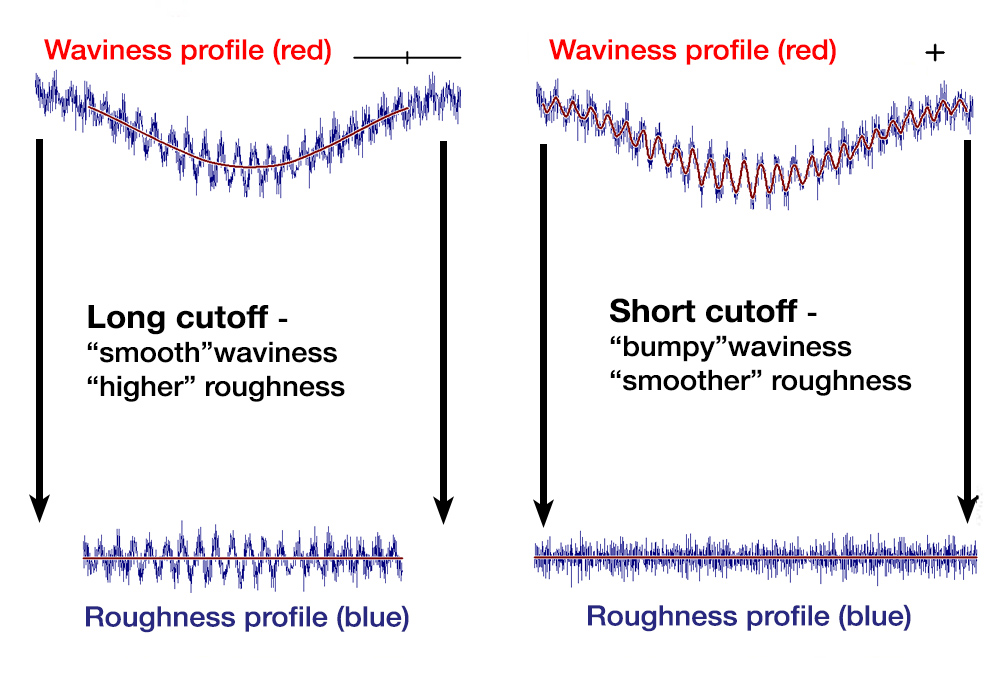
The effect of different roughness cutoff wavelengths on the waviness and roughness profiles.
Filter types
The type of filter employed will also critically impact the measurement results. A traditional “Gaussian” filter is a weighted moving average calculated at each point across the profile, as in the image below. The filter tends to smooth out the data.
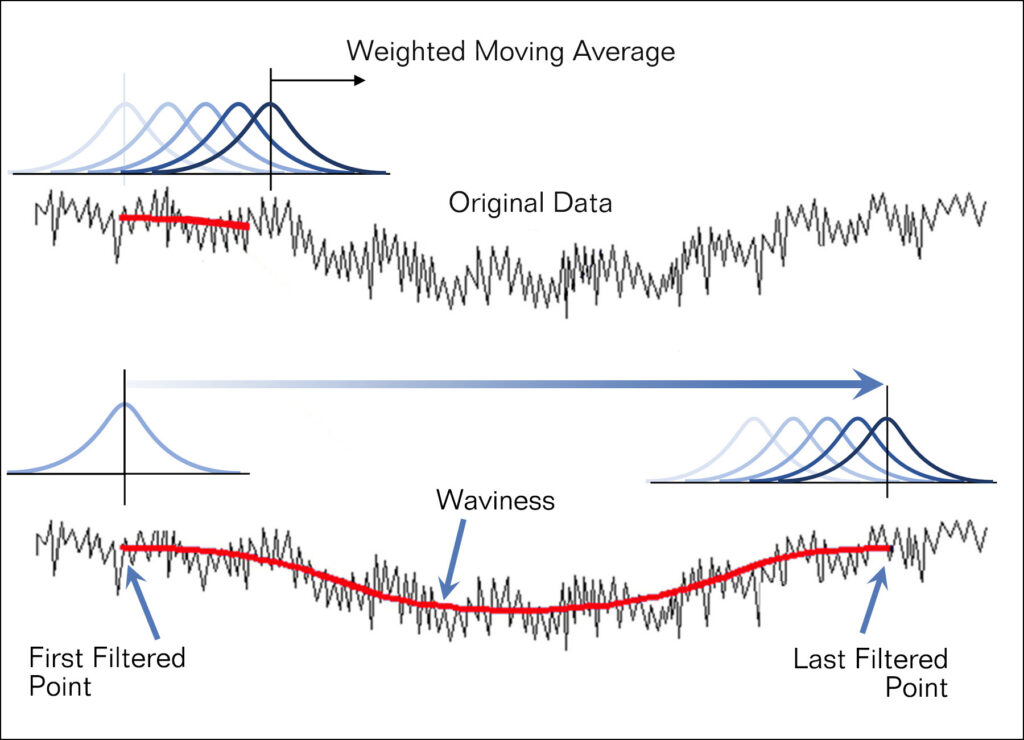
A Gaussian filter is a weighted moving average calculated at each point across the profile. Courtesy The Surface Texture Answer Book.
The deep valleys of a plateaued surface can cause difficulties for the Gaussian filter. When the filter encounters a valley, the valley locally pulls down the averaging of the filter. In the profile graph below, we see that the red waviness profile is pulled downward in the region of the deep valleys. When we subtract this waviness from the primary profile to obtain roughness, we then see false peaks in the roughness data in the vicinity of the valleys. Another way to think of this is to consider that roughness peaks are made up of anything above the waviness profile. When the waviness profile is pulled down, the regions above it become peaks in roughness. These peaks may falsely suggest a problem with the honing process or, worse yet, they may falsely lead one to believe that there is actually raised material.
Deep valleys can pull down the weighted average, resulting in false peaks in the roughness profile.
To address these “false peaks,” a better filter has been developed called the “robust” filter, which has been standardized by ISO. The robust filter is not influenced by extreme data points (whether upward or downward). Thus, the robust filter’s waviness profile does a much better job of following the trends of a plateaued surface than does a Gaussian filter. In the image below, the robust waviness profile (red) is not influenced by the deep valleys (unlike the Gaussian waviness profile above). Similarly, note that the roughness profile below does not contain the false peaks.
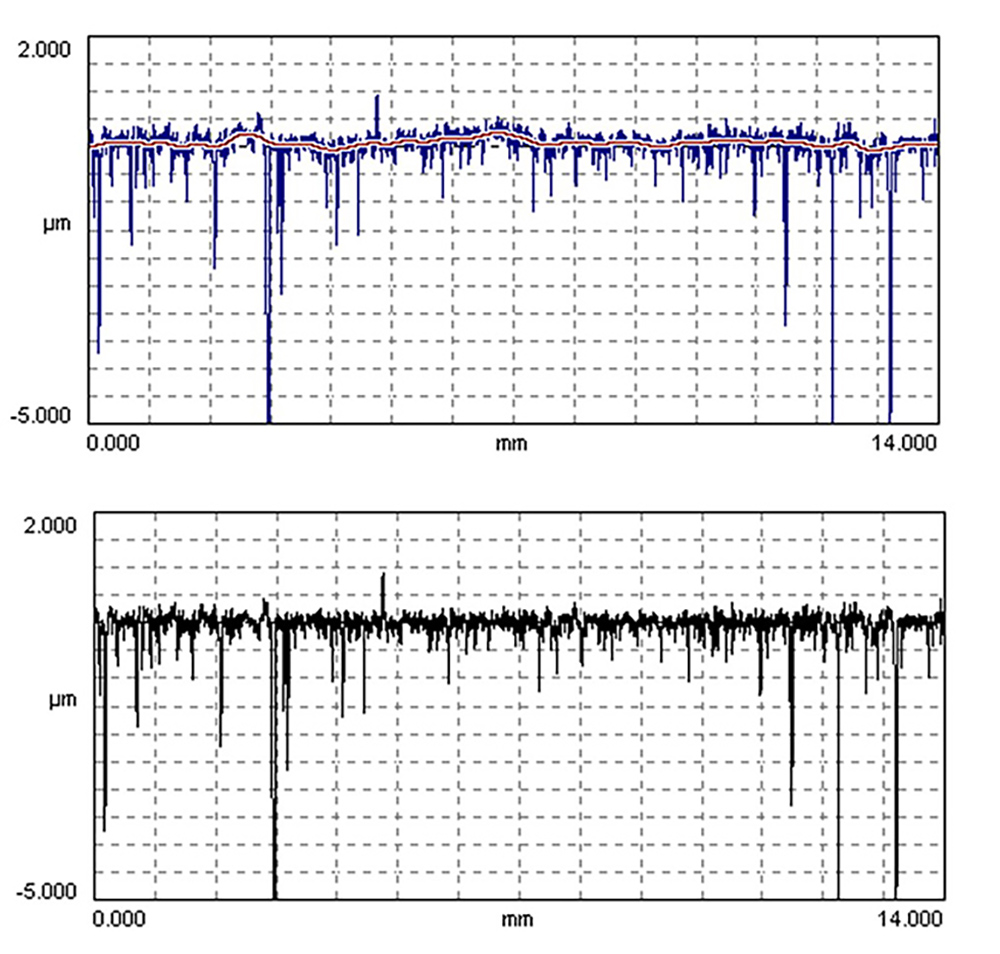
A robust filter does a better job of following the trends of a plateaued surface.
It should be noted that robust filtering may cause problem when dealing with dirt/skid interactions. If a surface has local dips caused by the skid passing over debris, the robust filter will try to “bridge” these areas, resulting in a deep hole in the roughness data. Again, the only sure way to avoid such issues is to measure a clean part—filtering cannot compensate for contamination.
You may also encounter a third type of filter called the Valley Suppression or “ISO 13565” filter. Developed in the 1980s, this filter type was intended to overcome the false peaks generated by the Gaussian filter. However, it tended to cause serious distortion in the presence of dirt/debris and does not completely remove the influence of deep valleys. Therefore, it is no longer recommended to ISO standards—but it may, in some cases, be employed automatically, as we will see in just a moment.
Choosing parameters
As we showed above, various cylinder surfaces may have very different characteristics depending upon how they were honed or even the “amount” of plateauing. As it turns out, each of the three types of surfaces mentioned above (single-honed, plateaued, and extremely plateaued) are best controlled using a different set of surface texture parameters.
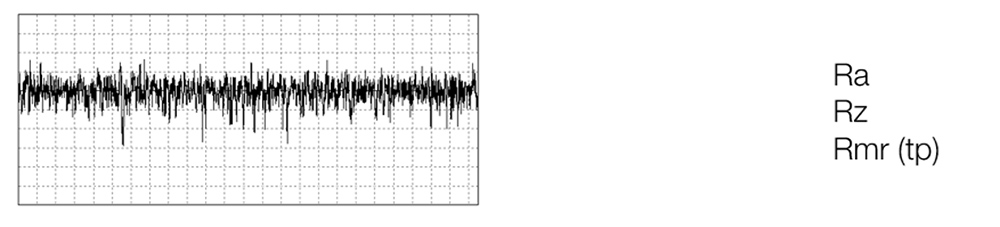
R Parameters
For a single-honed surface (sometimes referred to as a “peak honed” surface), the manufactured texture consists of peaks and valleys of all heights and depths. Over the initial run-in period the action of the piston rings will wear away the higher peak material, leaving behind the plateaus.
Traditional roughness parameters such as Ra (Average Roughness), Rz (10-point Roughness Height) and Rmr (Material Ratio) are often sufficient to control the honing operations for a single-honed surface. As the surface wears, or becomes a bit more plateaued, Ra tends to be most sensitive to the plateaus since there are more data points in the plateau. Similarly, as the surface wears or becomes more plateaued, Rz tends to be most sensitive to the valleys as they make up most of the peak-to-valley distance. Rmr (based on the user-defined depth) may loosely describe the amount of material where the plateaus and the valleys meet.
In the early 1990s, the piston ring company AE Goetze codified the use of these parameters for controlling cylinder bore texture in the very popular, “AE Goetze Honing Guide.”
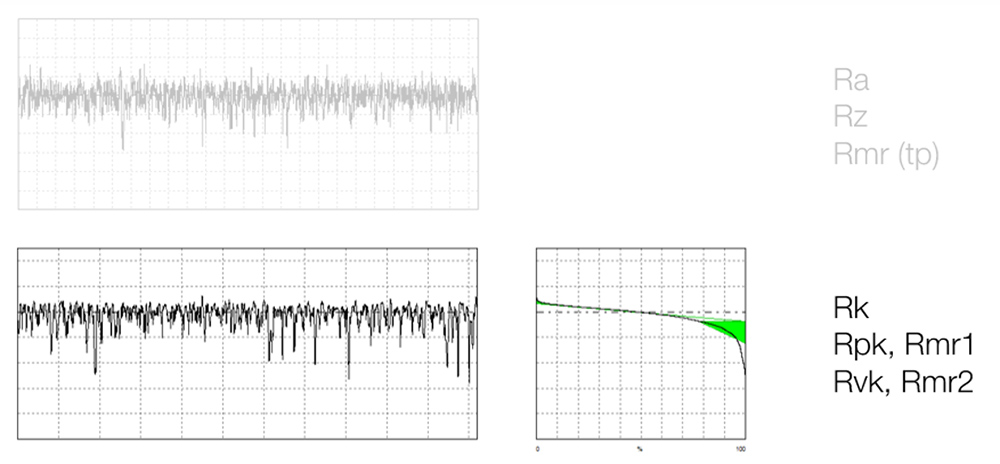
K parameters
As honed surfaces became more plateaued, it became apparent that Ra, Rz and Rmr could not robustly distinguish a plateau honed surface from a single-honed surface. Very different surfaces produced similar values for the parameters.
To better describe plateaued surfaces, researchers developed the “K” family of parameters, which are based on the material ratio curve, shown below on the right. The individual parameters (Rk, Rpk, Rmr1, Rvk, Rmr2) quantify the peaks, valleys, and core (or kernel) material, respectively. The K parameters allow for better control of plateau honing as they are more targeted toward the individual geometries within the surface.
Other, additional K parameters, such as Rvo (the oil-holding volume, sometimes referred to as “crevice volume” or “CV”) have also been developed from the material ratio curve.
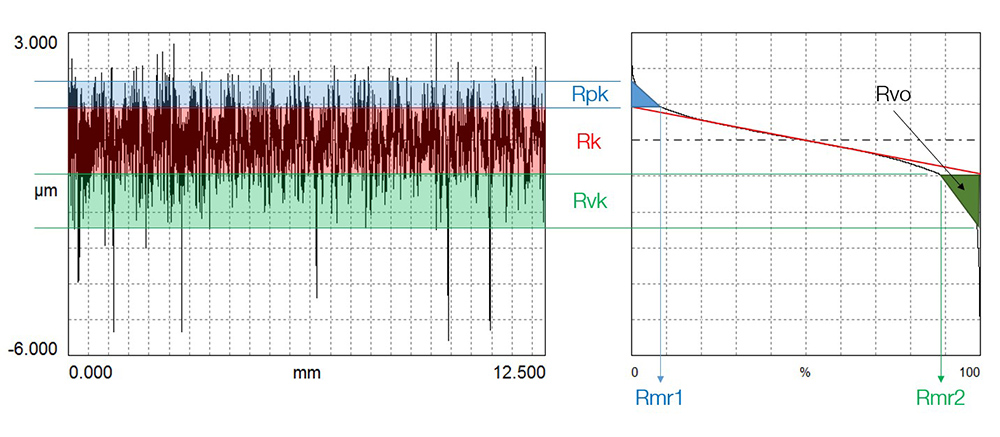
Rvo parameter. Courtesy The Surface Texture Answer Book.
You may also see Rpk* and Rvk*, which measure the peak region to the highest spike and the valley region to the deepest valley. These parameters tend to be extremely noisy and highly influenced by dirt and porosity, respectively.
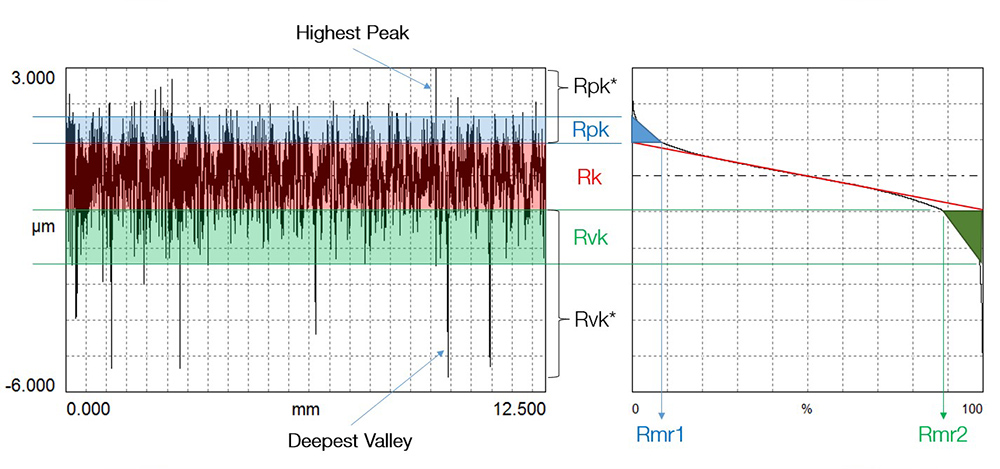
Rpk* and Rvk* parameters. Courtesy The Surface Texture Answer Book.
Earlier, we hinted that the Valley Suppression (ISO 13565) filter may still be lurking in some software—and here it is. This filter was developed at the same time as the Rk parameters, and in many gages, when you calculate the Rk parameter, the Valley Suppression (ISO 13565) filter is automatically used. On some instruments, even if you select Robust filtering, the valley suppression filter will still be used for the Rk parameter (though all other parameters will be calculated using a robust filter). It is important to know which type of filter is being applied, especially if you need to compare data between instruments or types of instruments.
Material Probability “Q” parameters
The cylinder bore surfaces of high-performance engines tend to be more extremely plateaued, with a strong distinction between the peaks and the valleys.
Unfortunately, neither the standard (Ra, Rz, Rmr) or K (Rk, Rpk, Rmr1, Rvk, Rmr2) texture parameters can describe these surfaces sufficiently. When a surface is extremely plateaued, the Rk parameter model does not fit the material ratio curve well and, subsequently, the Rk parameters become unreliable. The more plateaued the surface, the worse the Rk parameters perform. Furthermore, the Rk parameters are not independent. For example, a change in Rk will mathematically result in changes in Rpk, Rmr1, Rvk, and Rmr2.
An extremely plateaued surface can be considered to consist of two distinct distributions. The rough, first process is truncated by the second, fine hone, as below.
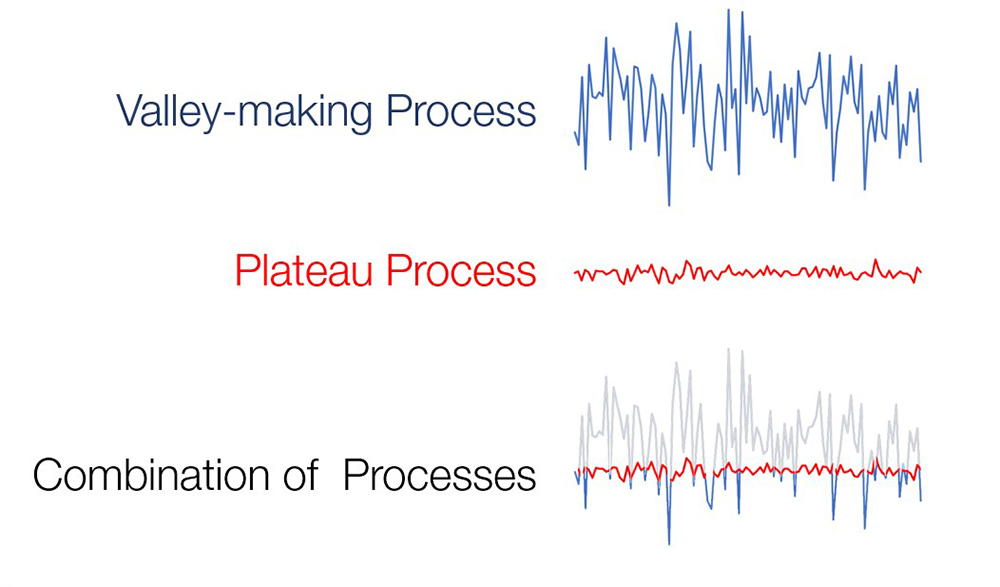
Extremely plateaued surfaces consists of two distinct distributions. Courtesy The Surface Texture Answer Book.
Mathematically, we can think of the valley-making process as producing a wide, random distribution (blue), and the plateau-making process as creating a narrow, random distribution (red). Combining them produces the distribution shown below.
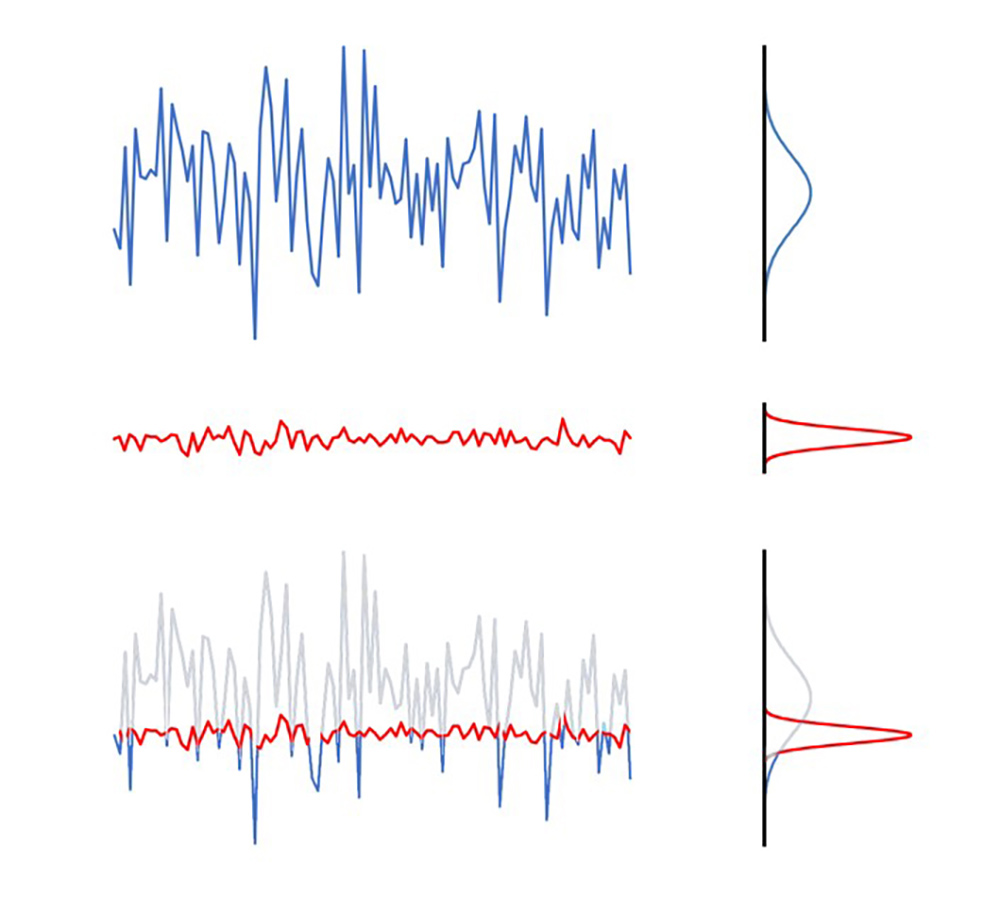
Mathematical representations of the two distributions combined. Courtesy The Surface Texture Answer Book.
Plotted on probability paper, these distributions become straight lines that meet with a sharp knee. Together, they form the material ratio curve; however, in this case, the material ratio curve is plotted with a special “probability” x-axis.
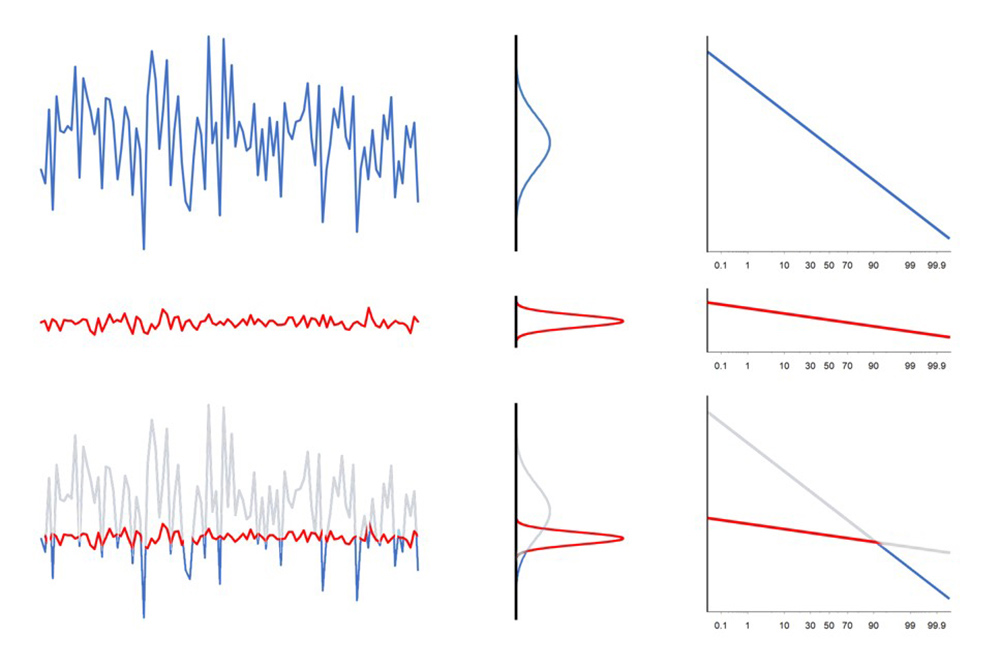
The combined curves form a material ratio curve, plotted with a special probability x-axis. Courtesy The Surface Texture Answer Book.
The Q family parameters are derived from this “material probability” curve. These Q parameters (Rpq, Rvq, Rmq) derived from this curve can robustly distinguish the surface regimes for extremely plateaued surfaces.
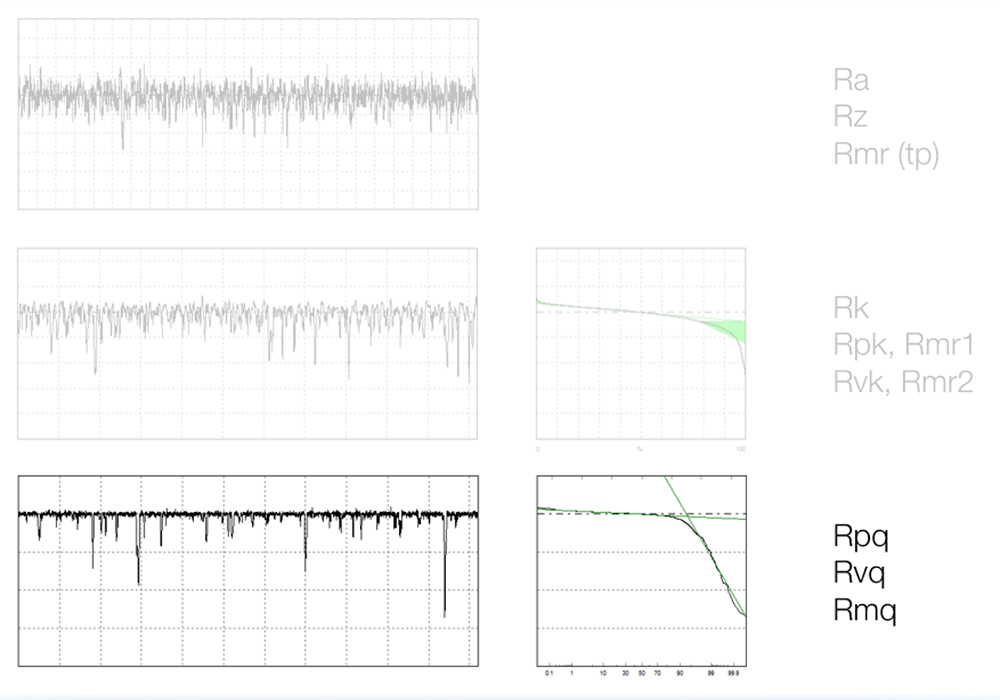
The Q parameter family includes three independent parameters: Rpq (the RMS roughness of the plateaus), Rvq (the RMS roughness of the surface that produced the valleys), and Rmq (the material ratio where the plateaus meet the valleys).
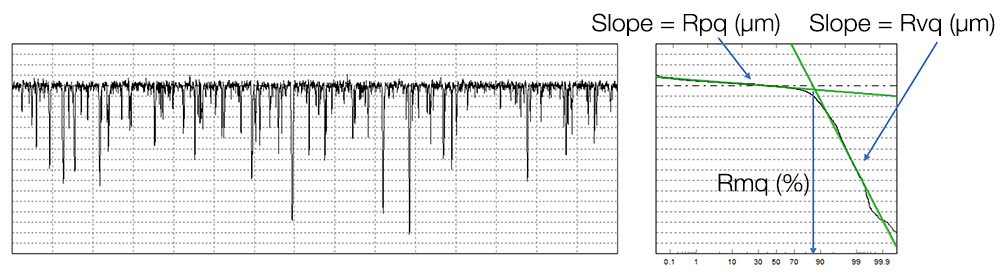
The fact that these parameters are independent is very important and very powerful. Unlike the K parameters, with the Q parameters, we can independently monitor the peaks, the valleys, and their relative positions. A change in one parameter does not mathematically result in a change in the other parameters.
Each set of parameters has its use. The Q parameters (Rpq, Rvq and Rmq) work best on two-process surfaces with discrete plateau and valley regimes. The Q parameters are less reliable when the distinction between plateaus and valleys is less clear. In fact, if the surface isn’t distinctly plateaued, the Q parameters may provide no results at all.
The K parameters work well in cases where extremely plateaued surfaces are not required. These include not only cylinder bores but gears, bearings, transmission components, and many other surfaces required a degree of sealing, loading, and/or friction control.
And, the basic parameters Ra, Rz, and Rmr still provide useful feedback for surfaces with a wide distribution of peaks, valleys, and intermediate heights.
Controlling crosshatch angle
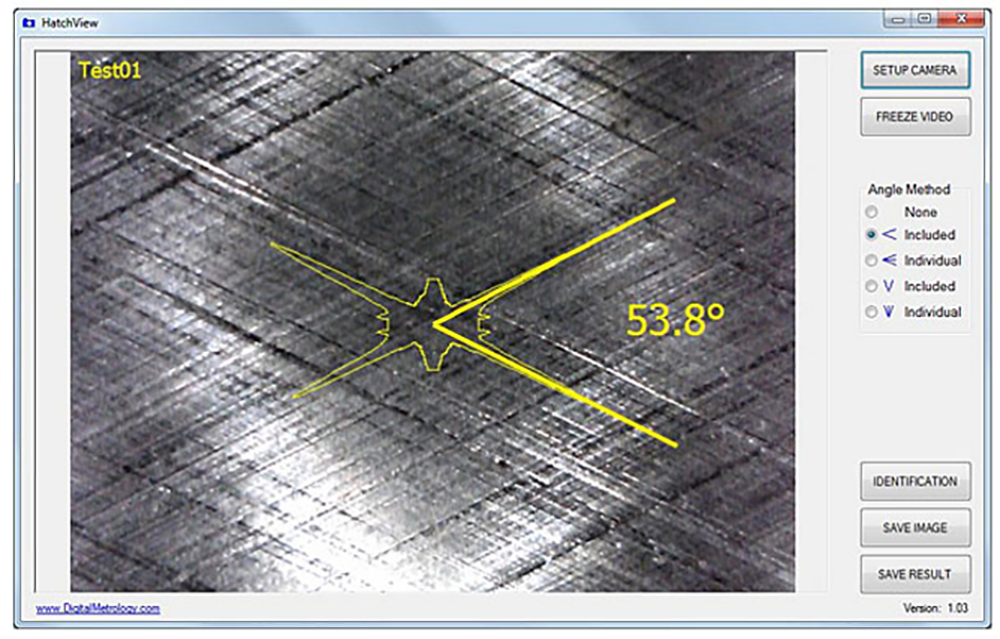
As we mentioned earlier, to control a cylinder bore surface, we not only need to control the geometry of the surface profiles, but we also need to control the crosshatch angle of the valleys. Oil consumption and combustion gas flow are directly related to the crosshatch angle. If the direction of the texture were purely in line with the motion of the piston there would be no seal formed, and oil and combustion gases would both escape readily through the interface. If the angle were perpendicular to the piston movement, no lubrication would flow into the interface, leading to excessive heat and premature failure. In an ideal situation, the cylinder bore texture and crosshatch angles are optimized such that the piston draws lubrication up, just to the point of combustion. The last bit of oil is held there by the combustion gas pushing down, and the process repeats with virtually no loss of lubricant and no blow-by of combustion gases.
Crosshatch angles can be measured manually with a protractor or other device, or it can be processed digitally. Tthe angle cannot be determined from a single, 2-dimensional stylus profile. The image below shows an optical image of the bore surface in Digital Metrology’s HatchView software. The calculated crosshatch angle is displayed in yellow.
Torn and folded material
During the honing process, the honing stones may smear the peak material rather than shearing it, which produces torn and folded metal. These areas tend to be thin, brittle, and hard, tending to break off and cause debris. Torn and folded edges can appear as white “flakes” in properly configured SEM images.
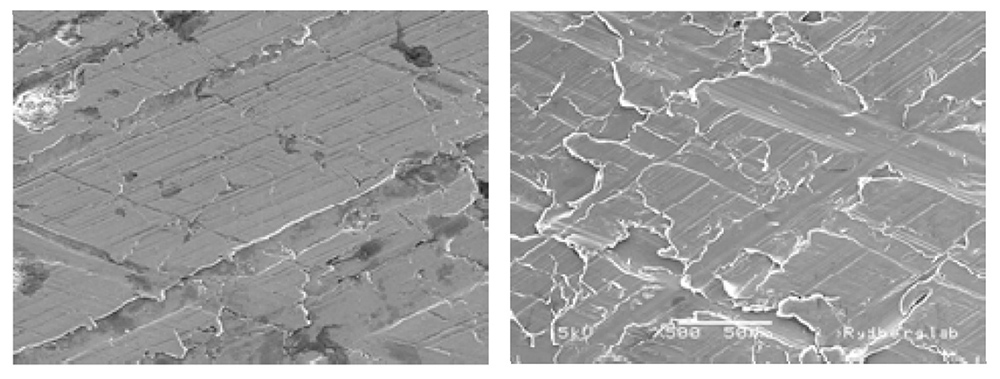
SEM images of cylinder liners with different degrees of folded metal. From Cylinder Liners and Consequences of improved Honing1.
Describing the “amount” or “severity” of torn and folded material with numbers and tolerances is very difficult. Many papers have been written in an attempt to describe this, and some have shown some limited success in rather narrow classes of surfaces. Currently, assessment of folded metal is almost entirely visual, with an inspector evaluating an SEM image, a replication film (or facsimile/”fax” film)under a microscope, etc. While these surfaces can appear very bad to the eye, in many cases it is actually unclear how much torn and folded material can be tolerated.
Research continues to determine how much torn and folded material is acceptable, as well as methods to quantify the amount of torn and folded metal in a particular image. One of the approaches is to try to extract the crosshatch pattern from an image, and then evaluate the remainder (the “defect surface”), as shown below. This technique has been built into some instruments, though it has shown limited correlation with actual performance.
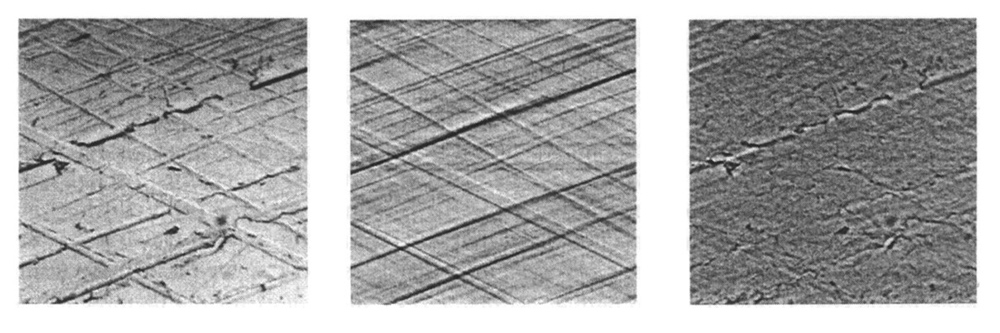
Original honing texture (left), valleys (center), and defects (right). From Evolution of Honed Cylinder Bores2.
We can also look at a surface such as the one (top, in the image below), then apply a radial Fourier transform (bottom) to get a sense of which directions may have an unexpectedly strong pattern, which could indicate torn or folded material.
Crosshatch analysis in Digital Metrology’s OmniSurf3D software.
Pullouts and Porosity
A plateau honing process applied to a cast surface may tend to tear out chunks of graphite from the surface, leaving pits and pores that could be many times deeper than the valley structures.
These pores are typically closed (not connected to each other) and, for the most part, do not represent leak paths. In some cylinder bore treatments, such as plasma or “spray bore” surfaces, this porosity is important and is monitored and controlled for lubrication retention.
The measurement and control of these “pores” is a challenge in that a stylus-based measuring device will often miss the pores or trace through the side of a pore rather than the bottom. Furthermore, the profile data cannot distinguish between pores in the material and valleys from the honing process.
A stylus instrument may not trace all of the pores through their deepest points.
An areal (3D) measurement, such as this data from an optical instrument, makes the pores easier to visualize. The data is shown here in Digital Metrology’s OmniSurf3D software, as viewed from “below” the surface.
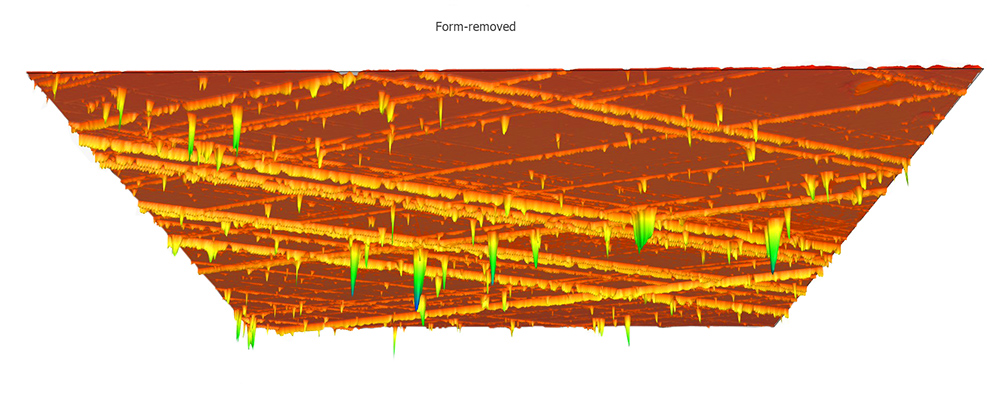
Areal (3D) imaging is more effective at imaging pores and pits, and discerning them from intentional valleys.
Using the latest technology for cylinder bore measurements
We’ve discussed several ways to measure, analyze, and control cylinder bore texture, as well as some pitfalls to avoid, particularly with older instruments and software. The best way to begin to understand surface texture is to start exploring your data on your computer, away from the pressures of the lab and the production line. Observing the shapes of various surface and becoming aware of trends and difference can quickly lead to a great deal of knowledge regarding the manufacturing of surfaces and their performance implications.
A practical way to take advantage of these advances is to adopt a modern surface analysis package such as Digital Metrology’s OmniSurf or OmniSurf3D software. These packages can handle data from a variety of instruments and can even be integrated into your measuring systems.
Digital Metrology has also developed many custom measurement solutions that are in use 24/7 in production settings.
There is a lot to know about cylinder bore texture, and we have spent literally decades staying at the forefront of changes in technology. If you’d like to discuss your measurement and analysis needs, we are here to help! Contact us today to start the discussion.
- Anderberg, C., Cabanettes, F., Dimkovski, Z., Ohlsson, R. et al., Cylinder liners and consequences of improved honing. NT2006-11-71. 2006.
- Léon, F. Puente, Evaluation of Honed Cylinder Bores, CIRP Annals, Vol. 51/1, 2002.