Here are two of our favorite pens: the “Uniball Grip” that we use with our logo, and the Pilot G-7 that we use for the Notepad Series. Both are relatively inexpensive, but they both write very well, and both grips feel great to hold.
Speaking of “feeling great,” we put the pen grips under the GelSight Mobile Series 1 (0.5x) to see what their surfaces look like. The GelSight is a “tactile 3D” system with an elastomeric sensor, so it may give a better representation of the “feel” of a surface.
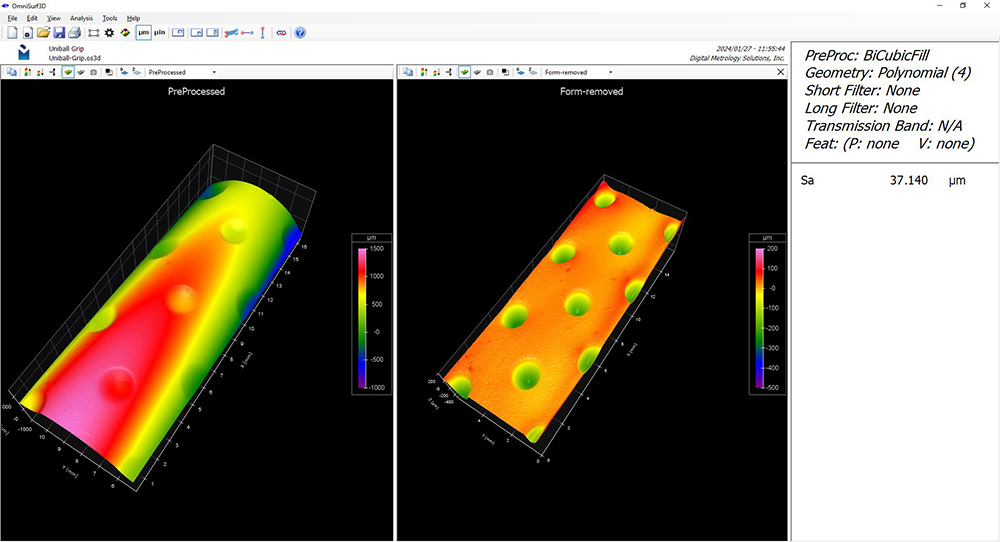
When we look at the data, we find that the two pen grips have almost identical Sa (average roughness) values: 37.133 µm for the Uniball and 37.140 µm for the Pilot—technically indistinguishable. Given those numbers, you would think that the surfaces must be quite similar…but as I’m sure you can guess, that is not the case!
Here is the Uniball pen, shown in OmniSurf3D software. The left pane shows the “Pre-processed” data. On the right, the overall shape (form) has been removed so that we can see the texture more easily.
Now, here is the Pilot G-2:
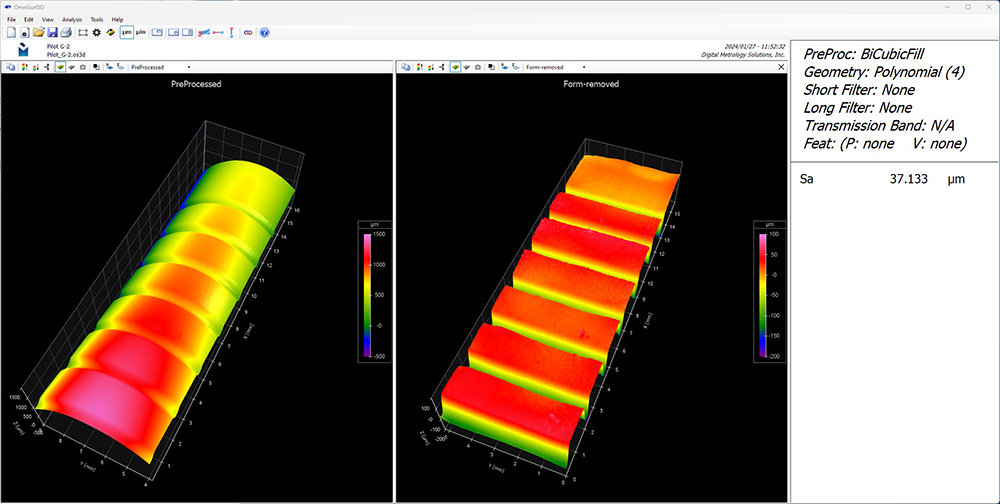
These surfaces are very different from each other! And yet, going by the numbers, the very different geometries cannot be distinguished by measuring Sa. The numbers alone can’t tell the whole story of a surface!
Want to explore these datasets for yourself? Check out the data in our free Surface Library!