Controlling flatness is critical for many surfaces. Functions such as sealing and load distribution are directly related to surface flatness. While controlling overall flatness is important, it may only be part of the answer. A gasket sealing with a head deck, for example, may tolerate a large amount of overall flatness variation…yet it may still leak if there is local flatness variation (within some small zone) that exceeds the conformability of the gasket.

Engine head deck surface. Photo Courtesy of QMP Racing.
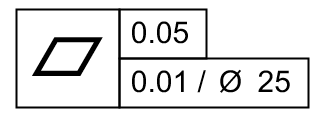
For this reason many flatness callouts include both overall flatness and zonal flatness (also called local flatness or per unit flatness) callouts. In the specification below the overall flatness must be less than 50 µm, and, perhaps even more importantly, the local flatness within any 25 mm radius zone must be less than 10 µm.
Most instruments that measure flatness provide a very rudimentary output—perhaps a table of zone values, but more often just a number. OmniSurf3D now offers an impressive alternative: the Zonal Flatness analysis, which reports local flatness in a highly visual, easy-to-interpret display.
The image below shows a measurement of the head deck area surrounding a cylinder bore, in OmniSurf3D’s Zonal Flatness window:
 on an engine head deck - Digital Metrology Solutions")
The analysis is very quick to set up. Select the size and shape (circle/square) of the individual zones, then click Compute. OmniSurf3D treats every zone as its own dataset, fitting a least squares plane and calculating the peak-to-valley flatness for each zone.
The display below shows the results. The flatness in the green zones is acceptable. Flatness in the yellow zones is approaching the tolerance limit (a 90% warning limit was set), and the red zones are out of tolerance.
 on an engine head deck - Digital Metrology Solutions")
The display is easy to interpret, and to customize. Change the Tolerance limit and Warning limit, for example, to quickly update the plot colors. Zones can be displayed as circles, as in the image above, or as transparent disks, as in the image below (you control the transparency with the slider below the plot).
 on an engine head deck - Digital Metrology Solutions")
You can export the results for the individual zones to a spreadsheet, or even export a false-colored surface model which includes the zone tolerance colors!
 on an engine head deck - Digital Metrology Solutions")
OmniSurf3D is full of tools that make data easier to import, analyze and interpret. Download a free 10-day trial to see for yourself how easy it is to explore your surface data!