The Rk parameters (Rk, Rpk, Rvk, Rmr1, Rmr2) are commonly used to specify and control plateau honing. However, there is a particular aspect of these parameters that can fool you… and it’s all about Rvk.
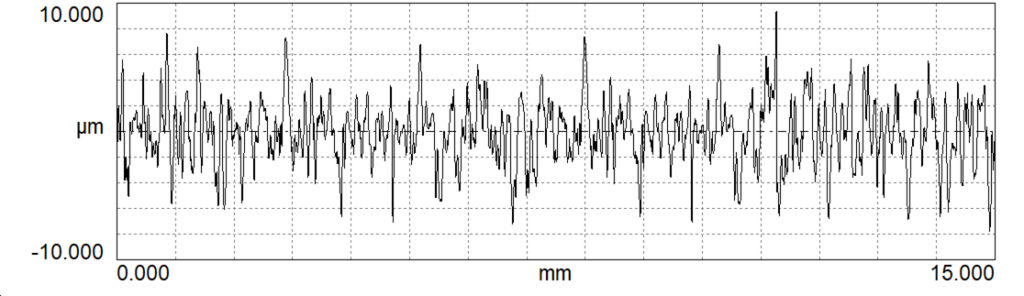
Let’s take a step back and look at the plateau honing process. We start by honing a relatively rough, semi-finished surface to create the surface’s valleys.
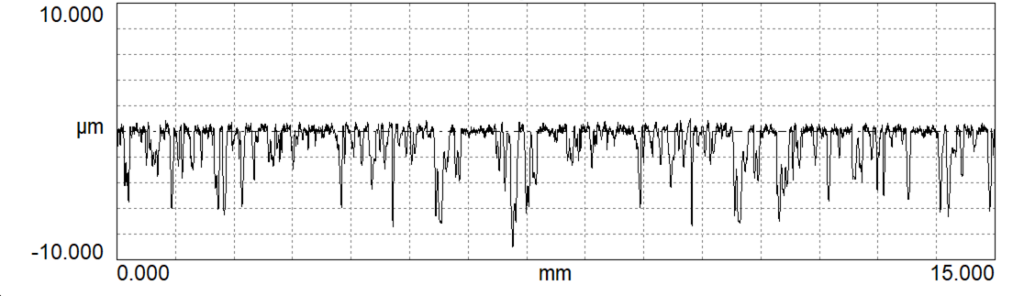
From there, we introduce a fine honing process to remove the peaks. The two honing processes give us a plateaued profile.
But here is where things get weird.
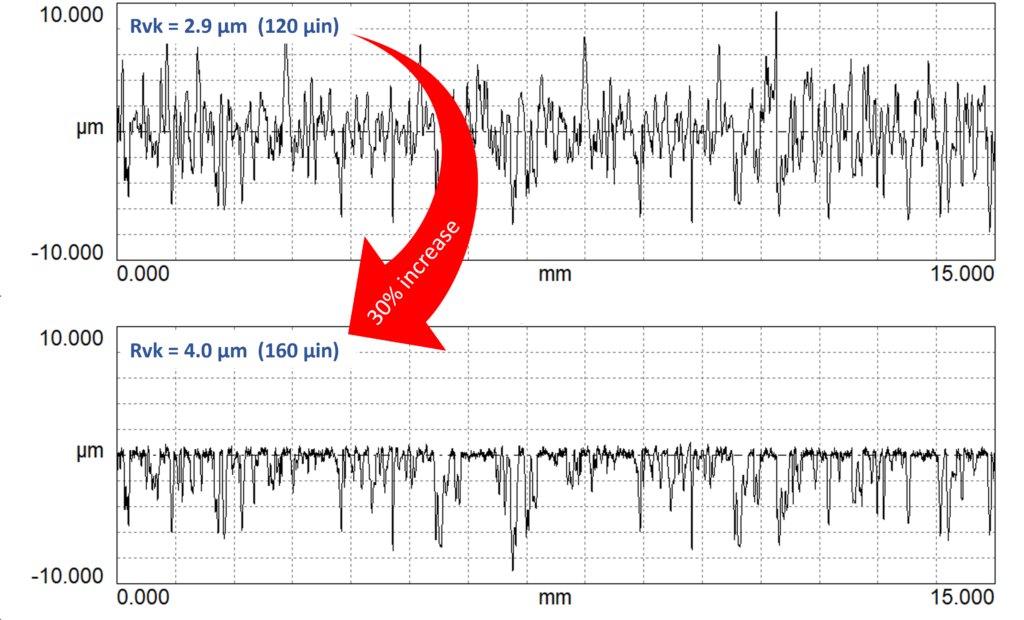
In terms of the Rvk parameter, this finished surface actually has more “valley roughness” than the original semi-finished surface. The original surface had an Rvk of 2.9, but after plateauing the Rvk is 4.0. How can the process of removing peaks result in a surface with more valleys?
This doesn’t make sense.
All we did was remove peaks. So where did the additional Rvk come from? Here’s the short answer. Rvk is based on detecting a plateau via the “Rk Line.” The semi-finished surface doesn’t have a plateau so the line can float around.
The details.
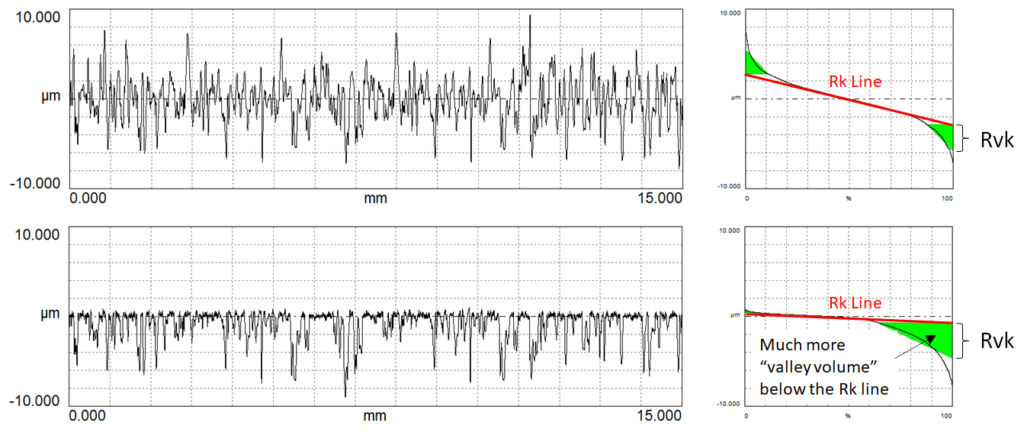
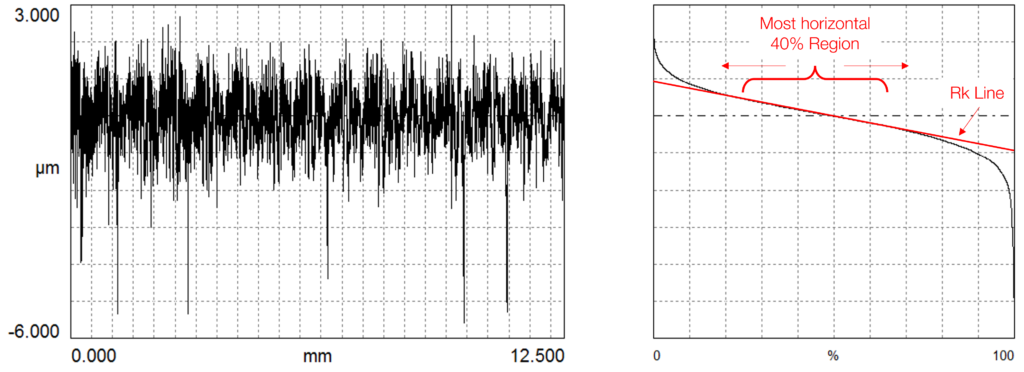
To fully understand the problem with Rvk on the semi-finished surface, we need to understand how the Rk parameter family is calculated. The first step in the process is to find the “plateau region” in the material ratio curve. This is accomplished by sliding a 40% wide window left and right until the most horizontal region is found. This establishes the “Rk Line.”
We now look at the right endpoint of the Rk line, which determines where the plateaus (Rk) meet the valleys (Rvk). This zone represents the oil holding volume of the valleys (or “valley area”) . For the Rvk calculation, a triangle is created with the same area as the valley area.
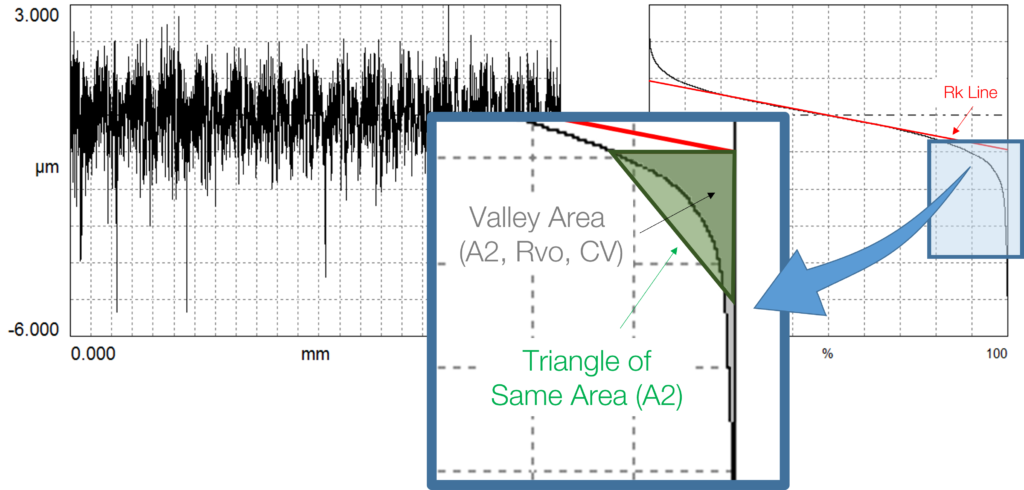
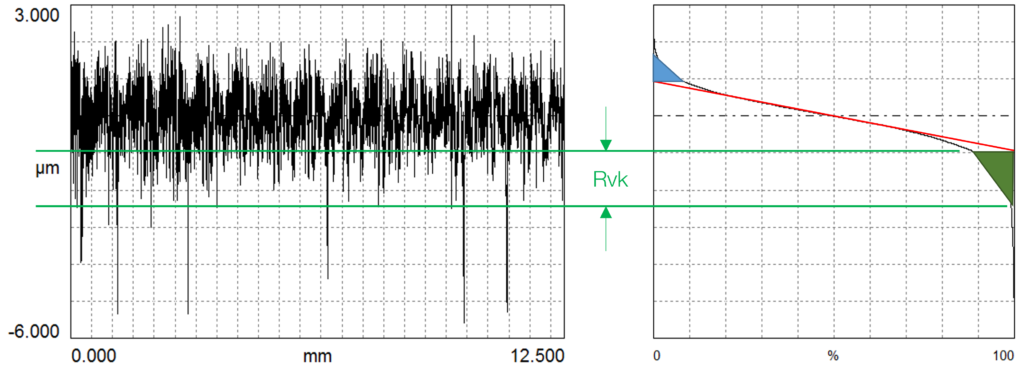
The Rvk (“valley roughness”) is the depth of the triangle.
So back to our original surface data.
The semi-finished surface isn’t plateaued, thus there is no clear way to determine where the valleys start. However, once we plateau the surface, we have a defined plateau and we can find the valleys.
As we revisit the figure, notice that the triangle is much narrower prior to plateauing and it increases significantly with plateauing. This increase in the triangle size can drive an increase in the Rvk value, giving the false impression that we are adding valley depth by plateauing the surfaces. In the above example, the Rvk value increased by 30%. This is huge when attempting to control a process to achieve a parameter target.
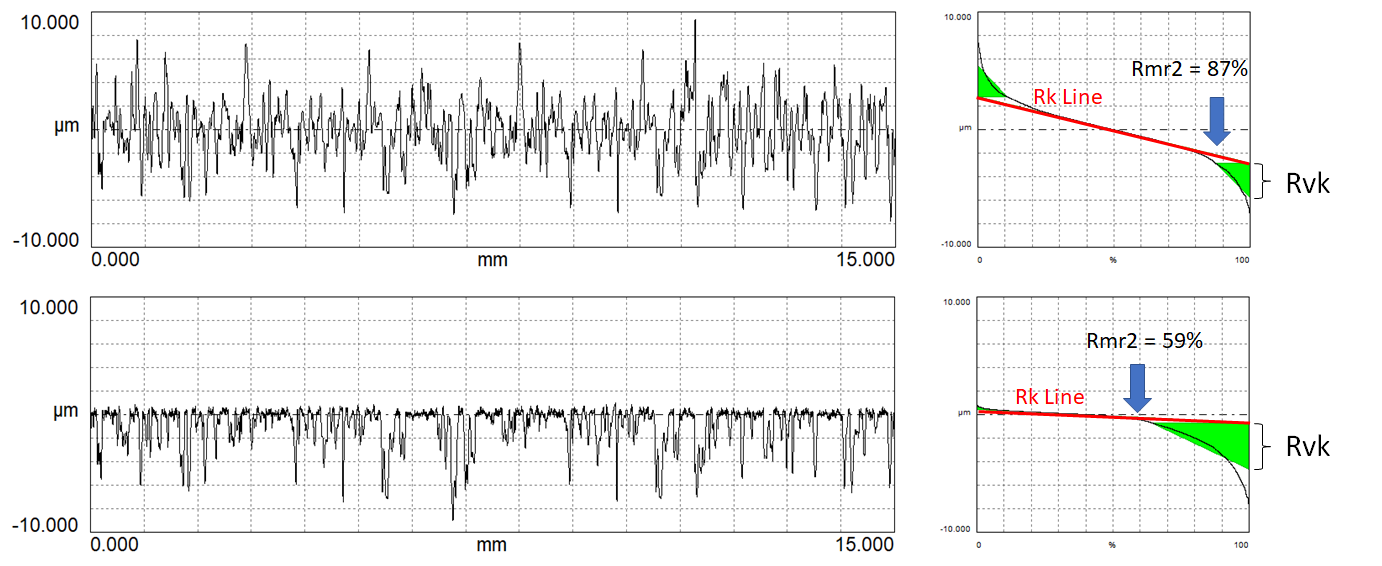
This can also be very misleading in terms of material ratio (Rmr2). The Rmr2 value indicates the material ratio where the plateau meets the valleys. It is sometimes used to indicate the amount of plateauing or even a sense of surface durability. Higher Rmr2 values indicate more material and possibly more load carrying capability. Oddly, in this case we would report a lower material ratio Rmr2 value after plateauing. This is not what we would expect as we know that increasing the depth of plateauing should increase the Rmr2 value.
It can get worse.
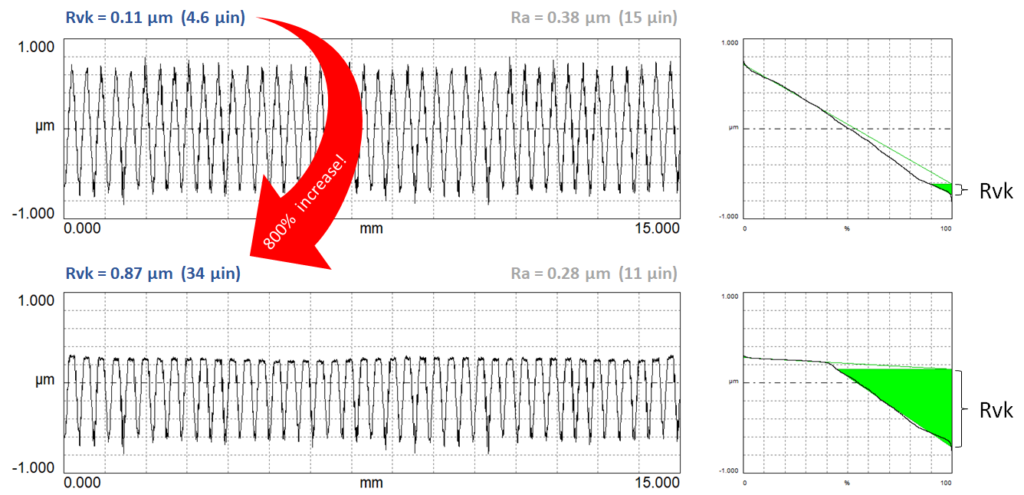
If a semi-finished surface becomes more triangular, the Rk analysis can essentially suggest that there are no valleys. In this case, even the slightest amount of plateauing can lead to a drastic (even 800%) increase in the Rvk parameter.
So what do we do about this?
The solution is rather simple: ignore the Rk parameter family in the semi-finished honing process, and use a better parameter instead. In many cases, the Rz (average peak-to-valley) parameter coupled with a clear profile graph is sufficient to describe the surface prior to plateauing. The Rz value indicates the depth of the surface, and the profile graph helps us see the distribution and depths of the valleys.
To learn more check out these great resources!
Software: TraceBoss—Roughness Measurement and Analysis for Your Portable Gage
Tutorial: Specification and Measurement of Plateau Honed Surfaces
Blog: Plateau Honing: Which Parameters Should I use?
Notepad Videos: The Rk Parameters
Software Video: Plateau Honing Analysis with OmniSurf3D
If you’d like to talk more about this topic or any other surface measurement and analysis need, we are here to help! Contact us today to start the discussion.