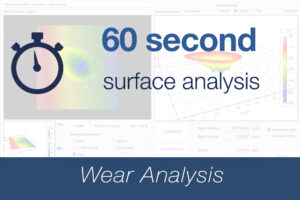
60-Second Surface Analysis Video: Wear Analysis
Analyzing wear depth is not something you’d usually think of as “fun”…but with the Wear Analysis in OmniSurf3D, it kind of is! In this video we use the Wear Analysis tool to quickly measure the depth and volume of a wear scar. The whole process is super-fast and really intuitive.
Read More
Wear Analysis Tool
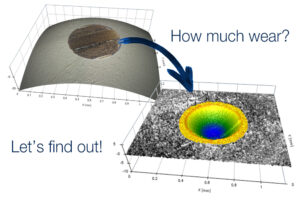
You have a worn component...but worn by how much? Or, perhaps you have several parts that have worn differently, and you need to know why.
The new Wear Analysis tool in OmniSurf3D lets you see the wear and describe it numerically, in just a few clicks. It can even handle complex underlying geometries.
See it in action in this video!
Read More
Notepad Series Video: Do our measurements agree?
What do you do when your measurements don’t match what your supplier or customer measured? In this Notepad Series video we show you a technique that can help you compare the measurements—not just the differences in the average values but also the variability in the measurements. It’s very helpful for interpreting differences in data.
Read More
Mark Malburg presenting at STLE 78th Annual Meeting
At the upcoming 78th STLE Annual Meeting & Exhibition, Dr. Malburg with present, "Measuring Wear the Right Way," discussing how modern tools and methods for assessing macro and micro wear can help to avoid costly decision making errors.
78th STLE Annual Meeting & Exhibition, Minneapolis Convention Center, Minneapolis, MN
Session 7K, Wear I, Thursday, May 23, Room 200 B, 9:00 am - 9:20 am
Read More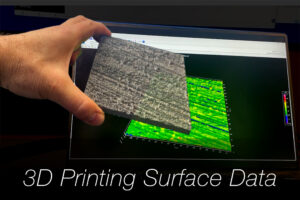
60 Second Surface Analysis – 3D Printing Surface Data
Viewing surface data in OmniSurf3D software is almost the best way to see and explore it. But you can take it one step further and 3D print a surface that you can actually hold in your hand. In this video we show you how you can 3D print surface texture from OmniSurf3D that you can see, touch, and share.
Read More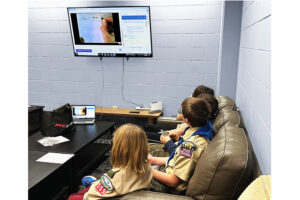
Surface Texture—meet The Scouts!
We love sharing what we learn about surfaces—so it's great to hear when that information has made an impact Not long ago some Scouts BSA members landed on our Notepad Series videos, which sparked them to take the initiative to learn more about surface texture. That led to an Engineering merit badge...and then some! Read all about it in this Surface Notes blog post.
Read More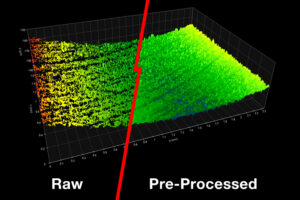
60-Second Surface Analysis Video: Missing Data Fill
3D texture data can look like a solid, continuous surface. But in reality, there’s space between the measured pixels, and some of those pixels may not have been measured at all.
Missing Data Fill is a pre-processing step that bridges those bad pixels, making data easier to interpret. But sometimes looking at the Raw data, before data fill, can be instructive as well.
In this 60-Second Surface Analysis video we look at how Missing Data Fill can smooth out missing pixels in surface roughness data. We also look at how you can use the Raw data view to check whether that missing data is a concern, or not.
Read More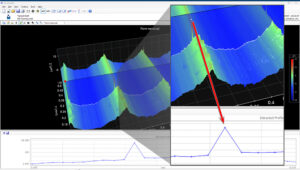
60 Second Surface Analysis – Can I really measure this feature?
When we look at surface texture data from a measurement system, we have to consider whether the features we are seeing are real, or whether they might be noise or bad pixels.
In this 60-Second Surface Analysis video we show how you can zoom in on a feature in OmniSurf3D software to see just how many actual measurement points we have for a feature. It’s a very useful tool, and a great sanity check.
Read More
A power boost for your measurement system
Custom software tools, or “helper applications,” can pick up where off-the-shelf instrument software leaves off, filling in features that are absent from native software. In this post we look at how a helper application can add custom parameters, analyses, and displays to native software, to optimize your measurement process.
Read MoreJoin Us at the Engine Performance Expo 2024
Join us at the Engine Performance EXPO 2024, January 11-12! Digital Metrology's Mark Malburg will be participating in a number of presentations and round table discussions with some of racing's biggest technology experts. Join the excitement online or in person.
see below for a schedule of talks and panels—hope you can join us for some very interesting discussions!
Read More