How to Remove Shape from a Complex Surface
Sometimes in surface texture analysis we need to measure difficult shapes, such as those resulting from a local process or local damage. Large features or distorted underlying geometry can further complicated the process. In this case study, we show the step-by-step process in OmniSurf3D for taming a challenging surface analysis task.
Read More
Notepad Series Video: Why Not Repeatability?
How good is my surface roughness gage? In this Notepad Series video we look at why repeatability is not a good judge of a stylus instrument's condition or capability. In fact, good repeatability may indicate a bad instrument!
Read More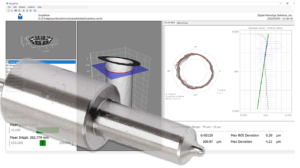
Solutions Showcase: NozzleView Software
Digital Metrology regularly works with metrology instrument providers and their end users to solve tough problems. This recent project is a great example. Digital Metrology developed the NozzleView software to better understand the geometry within fuel injector spray holes. These geometries are critical to fuel injector performance, but until recently they have been very difficult to measure and analyze. The NozzleView software lets users to analyze and explore the shape of each spray hole throughout its length, and to visually interact with the data to gain a better view, and better understanding, of the surface geometries.
Read More
Notepad Series Video: Peaks, Valleys and Skewness
The surface heights of many machined surfaces form a normal distribution with a common bell shape. But often we want a surface that is skewed toward the peaks or valleys. The Rsk parameter is widely used to report the direction and degree of skewness...but Rsk has some very serious issues baked into the math which can lead to incorrect conclusions.
In this video we examine the Rsk parameter, how it is calculated, and how the calculation can lead to instability. We also provide some alternative parameters that are more stable for production measurement.
Read More
Engine performance? It’s in the surface texture.
There’s information about your performance and machining processes hiding in your surface texture. But you need to be able to see it to improve it. We sat down with Brad, the larger-than-life personality who fuels QMP, to talk about how he and QMP mine surface texture for every ounce of performance from their engines.
Read More
Notepad Series Video: Measuring Short Surfaces
How much of a surface do you need to measure in order to accurately describe its roughness? For typical surfaces, the standards suggest an evaluation length 5 times longer than the roughness cutoff. But if you are measuring a narrow feature or part, the entire surface may be smaller than that 5X length.
In this video we show you how to determine the "evaluation length" for measuring roughness on a typical surfaces, and we introduce options for measuring texture on smaller surfaces. We also point out some pitfalls that can lead to incorrect evaluation of roughness and waviness.
Read More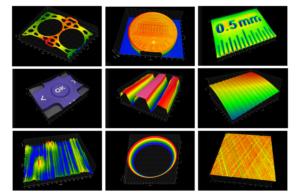
Surface Library: Free-to-Use Surface Texture Data
Digital Metrology's new Surface Library is a collection of data to help users explore, understand, and explain surface texture. The Library is intended for surface texture professionals, researchers, teachers, students, and anyone curious about surface texture. Over the years we have generated and collected thousands of surface datasets. Some datasets highlight common objects, some help show how a particular kind of analysis affects data. And some are...just fun.
Read More
Digital Metrology and Supfina in American Machinist Magazine
Our joint article with Supfina, "Creating a World-Class Digital Workflow," is now in American Machinist magazine. This article discusses the benefits of keeping measurement data as an active part of the development process, rather than archiving it in static formats. OmniSurf software has been a key part of Supfina's effort to "go paperless" in a way that lets them reuse their data for future projects, without remeasuring. Find out how Supfina has done it!
Read More
Notepad Series Video: Surface Texture and Wear
If you dug a hole in your yard, you likely wouldn’t assess how deep it was by describing the roughness at the bottom of the hole. Yet that's what often happens when we assess wear at the surface texture level. In this video we look at why roughness is not a good gauge of wear, and we’ll show you some better ways to quantify wear.
Read More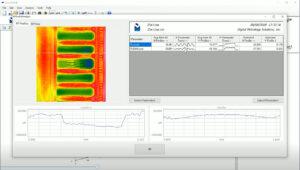
Video – XY Profile Analysis in OmniSurf3D
When working with areal (3D) surface texture data, we often want to examine 2D slices through that data. OmniSurf3D takes XY analysis further than most other software. Small charts called “sparklines” help you to quickly spot trends in parameter values. Sparklines also show which parameters are most sensitive to the variations that occur in the particular surface. This video shows how the XY Profile Analysis in OmniSurf3D provides a unique twist on cross-section analysis that makes it easier for you to find, interpret, and address trends in your areal 3D datasets.
Read More