What makes a stone feel good in your hand? What magnitude of surface roughness is required for it to feel that way?
We recently collaborated with stone enthusiast and retired metrologist Bob Rother to find out. Rother wanted to combine his passion for “rock hounding” with his background in process engineering and precision measurement to understand exactly what gives a stone a pleasing shape and texture.
Over fifty days this summer, we put a Brazilian agate sample through a four-step tumbling process. We measured the surface texture after each step with our Zygo ZeGage Plus optical profiler and used our OmniSurf3D software to analyze the results.
What we found was fairly striking.
Initial treatment
The process began with a large, Brazilian agate (Figure 1).
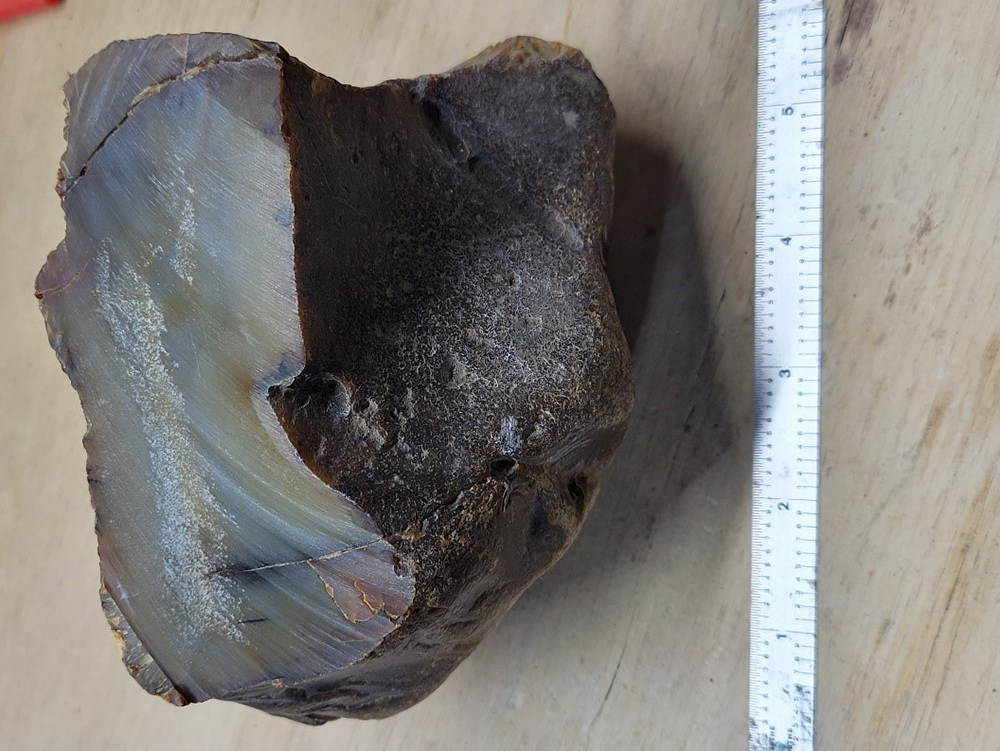
Figure 1. Brazilian agate specimen. Courtesy Bob Rother.
The agate was sawn into a series of slabs. On one slab, we found an arrow-shaped inclusion (Figure 2) that could serve as a reference, so that we could measure the same location after each polishing step.
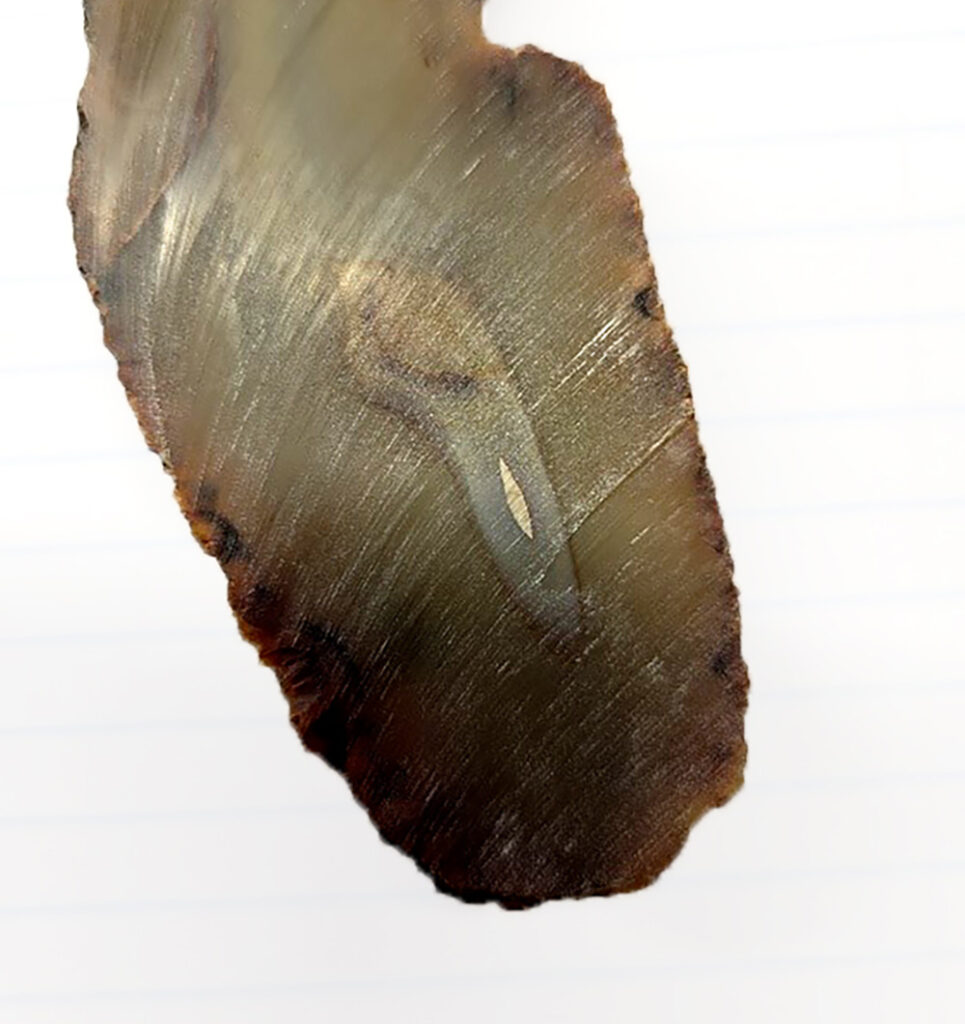
Figure 2. The stone after sawing. The light-colored inclusion served as a reference. Courtesy Bob Rother.
The polishing was done with a benchtop tumbler (Figure 3). Some of the tumbling media are shown in Figure 4.
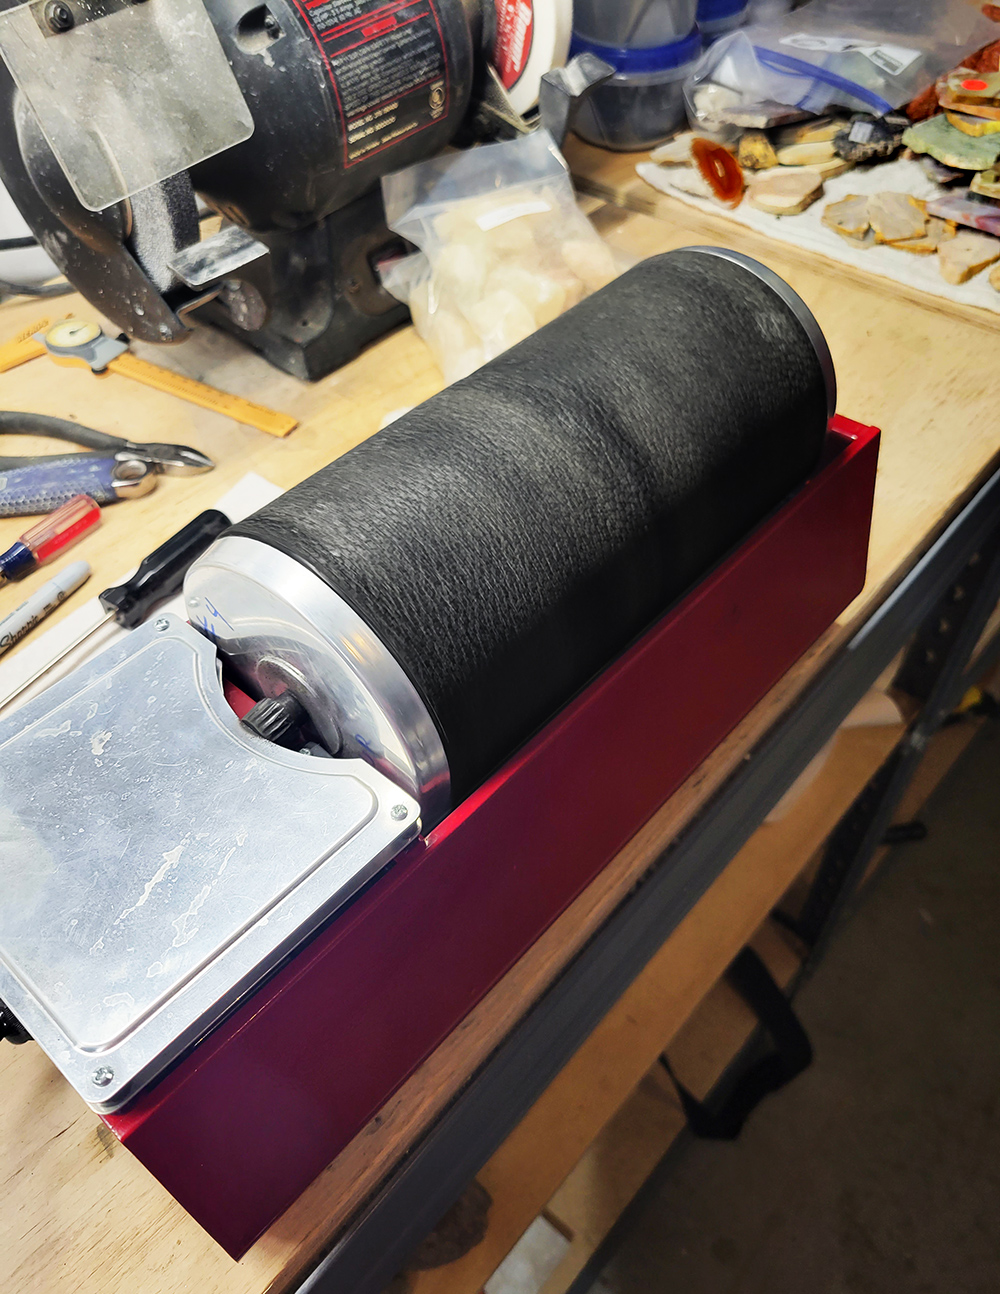
Figure 3. The benchtop rock tumbler. Courtesy Bob Rother.
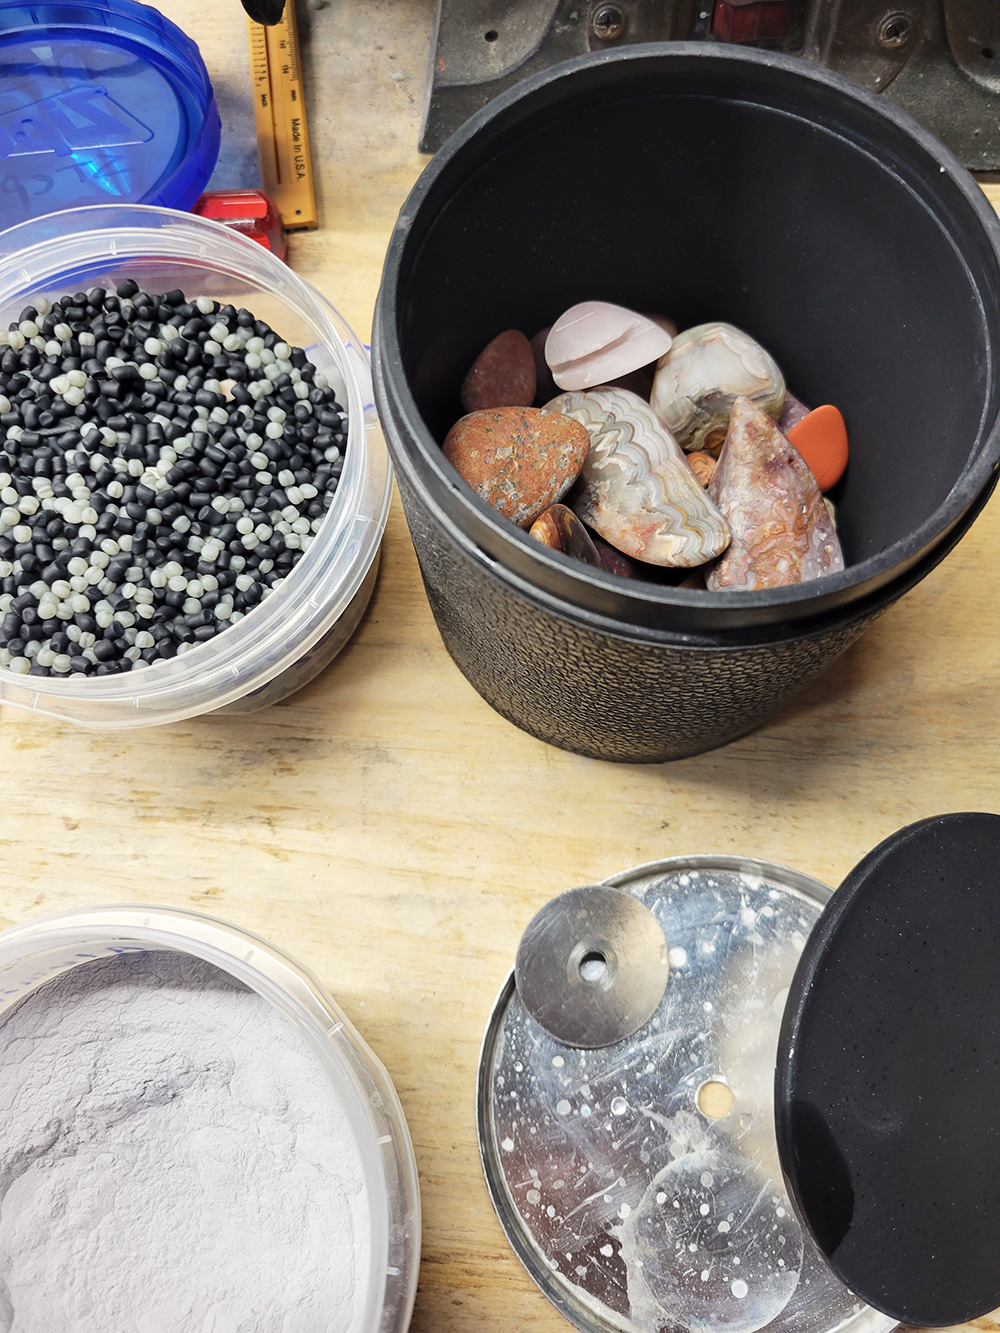
Figure 4. Tumbling media. Courtesy Bob Rother.
Figure 5 shows a 3.5 x 3.5 mm (0.15 x 0.15”) area of the stone surface. This dataset is large enough to show the saw marks and, faintly, the arrow-shaped inclusion at the center. To better see how the surface changes during polishing, we zoomed in on a smaller, 1 x 1 mm region to the left of the arrow (Figure 6). The starting Sa of this subregion was 1.5 µm.
NOTE: Click on the data images that follow to access the 3D datasets in our Surface Library!
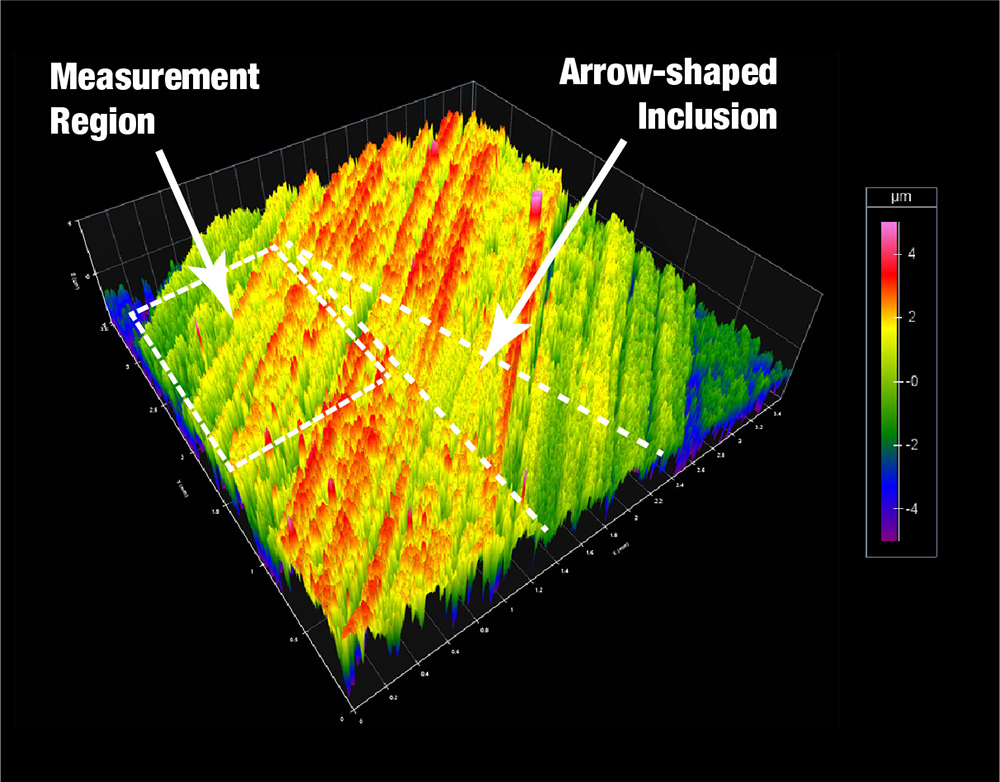
Figure 5. The 3.5 x 3.5 mm area after sawing. The arrow-shaped inclusion is faintly visible at center.
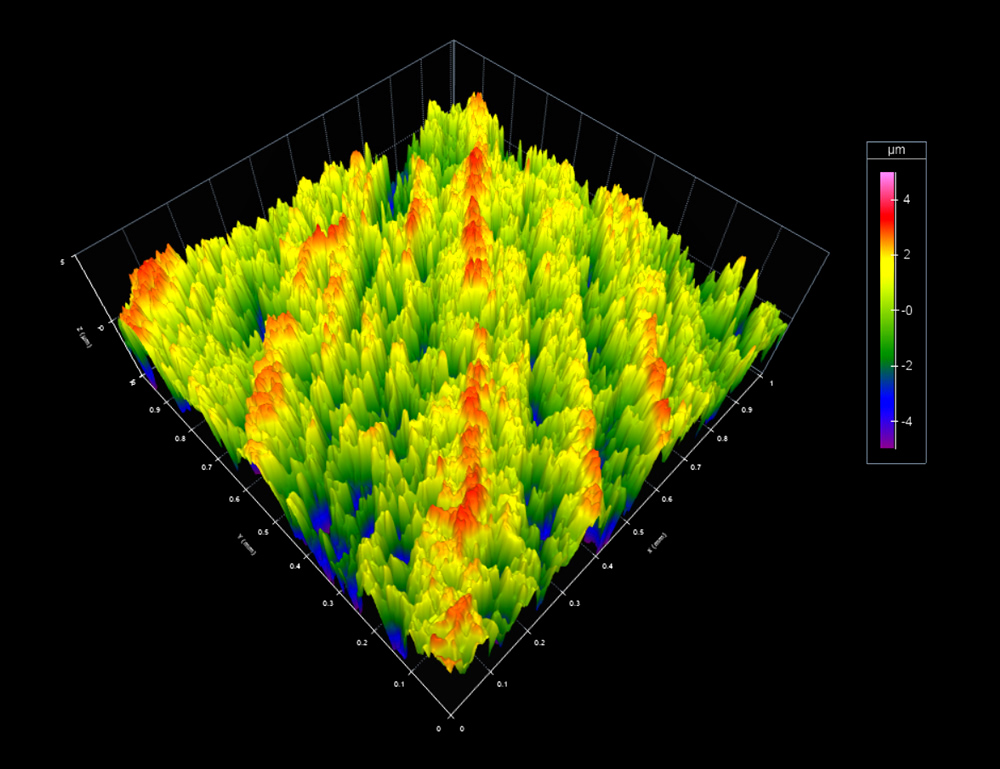
Figure 6. The 1×1 mm measurement area before tumbling. Sa = 1.5 µm.
60-grit tumbling
In two, 10-day long coarse tumbling runs, the stone was tumbled with other stones, 60–90 grit silicon carbide, and ceramic beads. Figure 7 shows the surface after coarse tumbling. The Sa value has dropped to 0.8 µm—about ½ the value before tumbling.
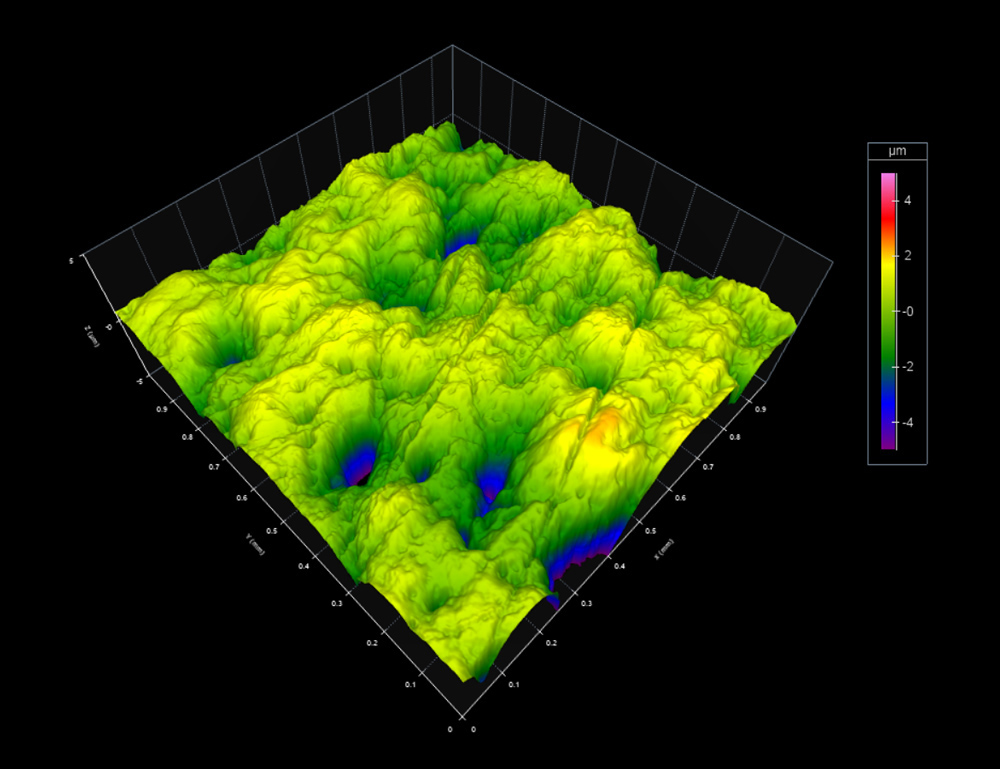
Figure 7. After two coarse tumbling runs. Sa = 0.8 µm.
Step 2. 125-grit tumbling
The second phase involved two more 10-day tumbling runs. This time the media was with 125-grit silicon carbide and plastic pellets. Figure 8 shows the surface after the intermediate polishing. The saw marks had been virtually eliminated at this stage. The surface felt smooth but not slick, with a uniform matte finish everywhere.
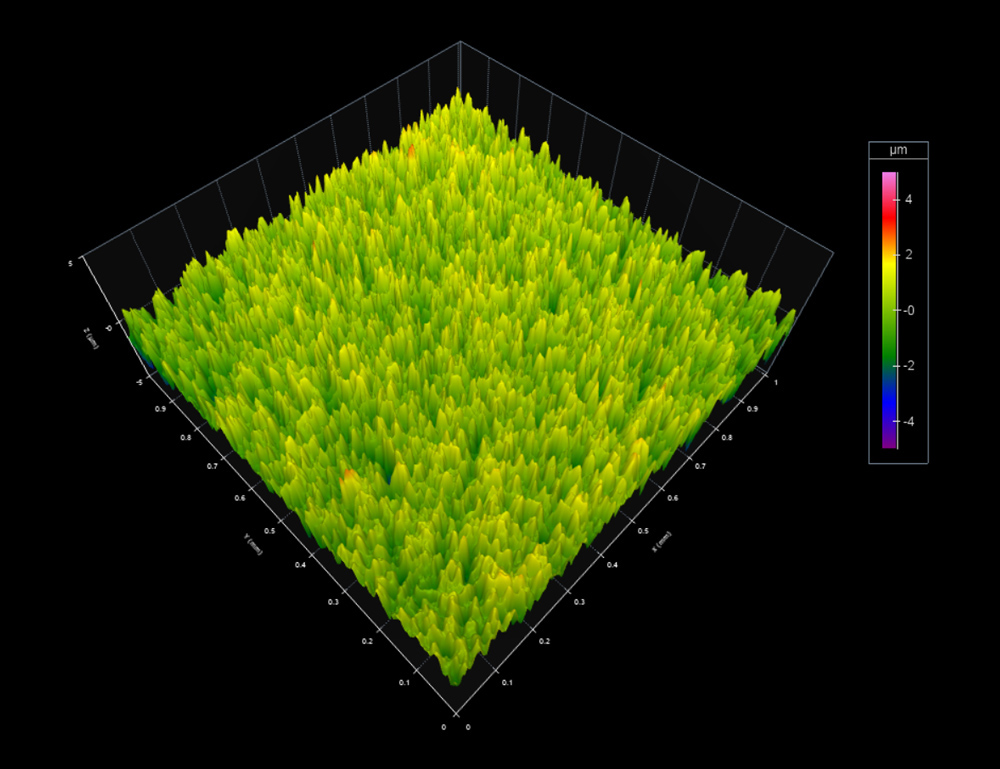
Figure 8. After intermediate polishing. Sa = 0.7 µm.
Step 3: 500-grit tumbling
After another 10-day tumbling pass, with 500-grit aluminum oxide and plastic pellets, the Sa dropped to only 0.19 µm (Figure 9). The stone had a smooth, yet matte, finish—but still not the slick feel that we wanted.
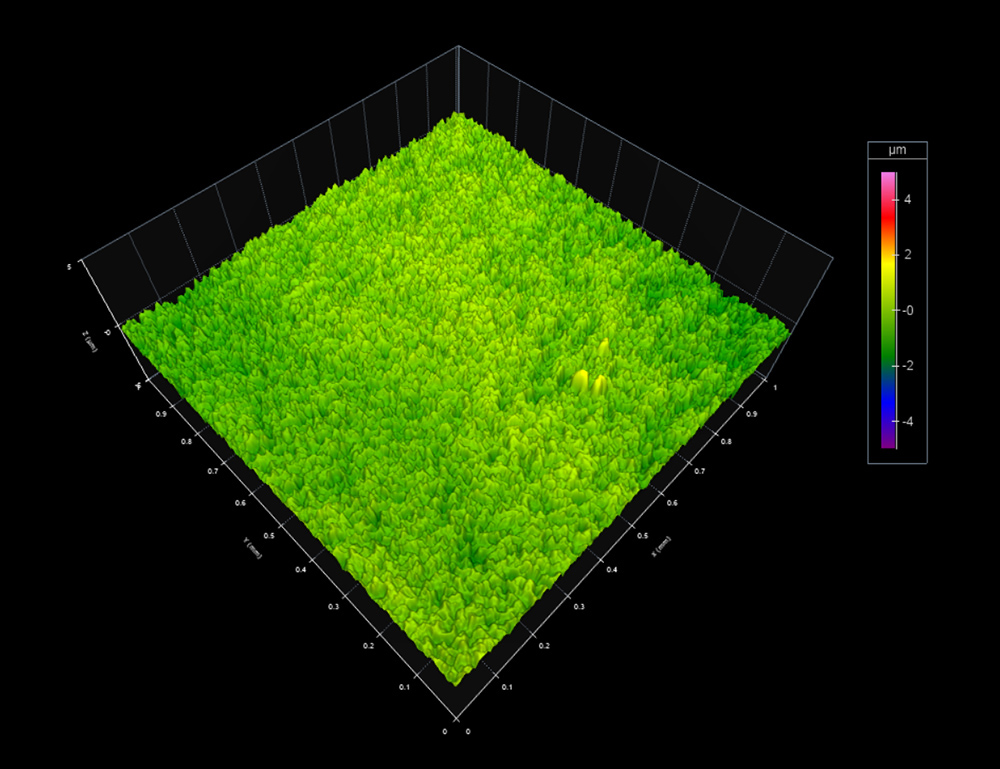
Figure 9. After 500-grit polishing. Sa = 0.19 µm.
Step 4: Final polish
For the final step, we tumbled the stone for ten more days with 1500-grit aluminum oxide polish and plastic pellets. When finished, the stone felt slippery and smooth, and it appeared very shiny, almost glass-like (Figure 10).
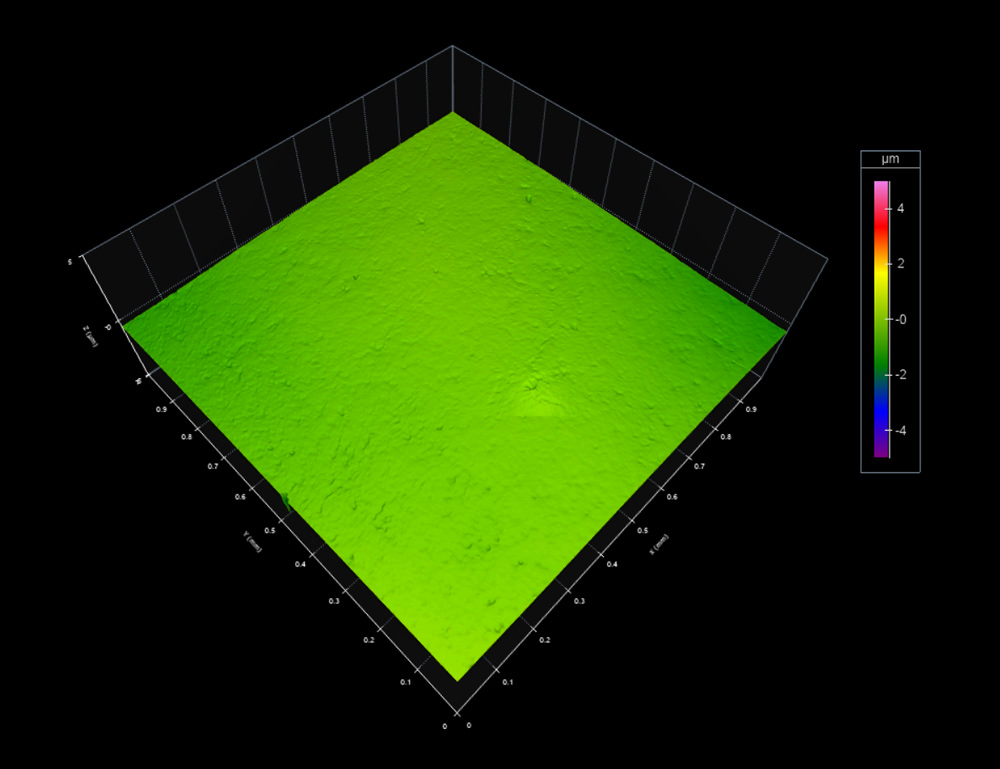
Figure 10. The final polished surface. Sa = 0.014 µm.
Figure 11 shows a comparison of the stone before and after polishing. We were very surprised to see that we had achieved an Sa value of only 0.014 µm. That’s remarkably smooth!
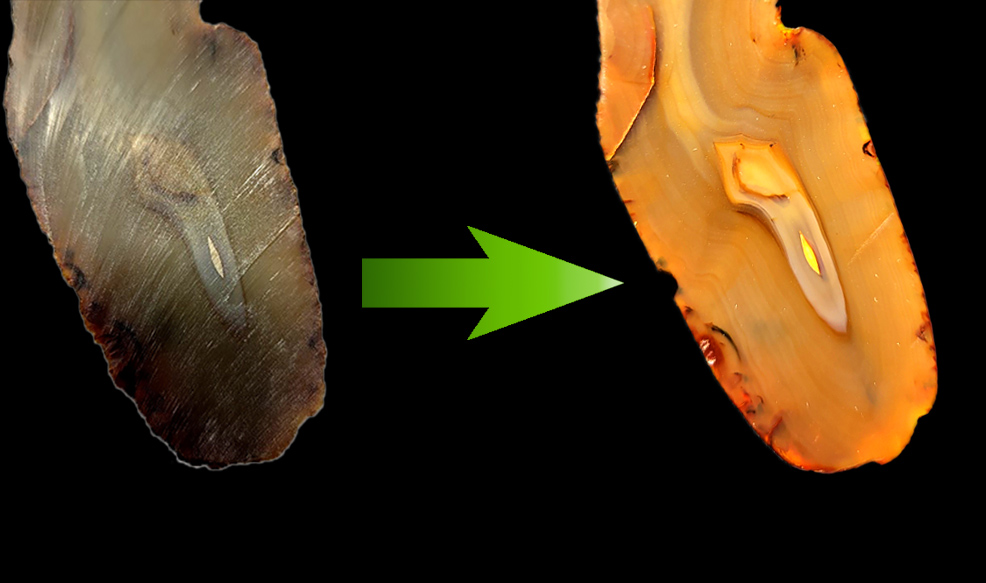
Figure 11. The stone before and after polishing.
This project took us all summer to complete—fifty days of tumbling. But it was fascinating to document how the stone surface was modified by each successive tumbling pass.
3.5 x 3.5 mm datasets showing the surface after each tumbling step are available in our Surface Library for you to explore for yourself!