
Notepad Series Video: 2D vs 3D (Areal) Texture
Is a 3D (areal) texture measurement “better” than a 2D (profile) measurement? There are strong opinions on both sides. But the truth is that there may be some common ground. In fact, there are cases in which each type of measurement may be the right choice. In this video we discuss the properties of 2D vs areal (3D) measurement systems. We talk about how the two are related and we show where one may be preferable over the other depending on the application.
Read More
Notepad Series Video: Stylus Tip Radius
Is a smaller stylus tip radius better for measuring roughness? Is a larger tip more durable?
In this video we discuss how the stylus tip radius influences what we see in surface texture measurement data. We discuss the short filter and how it provides consistency between measurement systems and stylus sizes.
We also look at a common misconception that a larger stylus tip radius is more durable than a smaller one. It's really not the case, and we will show you why.
Read More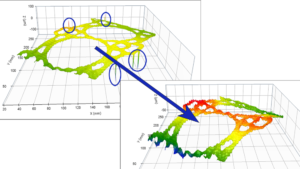
The Surface Editor Tool in OmniSurf3D
3D datasets often include missing or errant pixels, which can typically be solved by applying a median filter, peak/valley thresholds, etc. But in some cases the errors are too big or too isolated to filter out. For these cases, the Surface Editor Tool, unique to OmniSurf3D, lets you selectively repair missing data and data errors interactively. Find out how it works—and how easy it is to clean up a dataset—in this video.
Read More
Notepad Series Video: Fake Peaks and Filters
Are the peaks that you are seeing in your surface texture measurement real? In some cases the peaks in your graphs may not be real at all...they may be artifacts of the filtering operation. False peaks can make you think something's wrong, which can lead to unnecessary rework or even scrapping of good parts.
In this video we look at how the filtering process can sometimes lead to the generation of peaks that aren't there in reality. We also look at a better filter–the Robust Filter–that can provide more accurate representations of the roughness and waviness.
Read More
“The Surface Texture Answer Book” Is Now Available
A new resource makes it easier to find answers to surface texture related concepts and applications. “The Surface Texture Answer Book” is a Q&A style book that addresses more than 100 of the most commonly-asked questions regarding the measurement, analysis, interpretation, specification, and application of surface texture.
The 400-page paperback book is available through amazon.com.
Read More
Notepad Series Video: Specifying Waviness
In applications such as controlling sealing in gaskets or noise in bearings and gears, longer-wavelength waviness may be more important than shorter-wavelength surface roughness. In this video we look at how we extract waviness from surface texture data, using a "cutoff wavelength" to determine what will be considered waviness and what will be considered roughness for a given application. We also show how to specify waviness on a drawing so that we can measure and control it in production.
Read More
Notepad Series Video: The Rk Parameters
In this video we introduce the Rk Parameters, which are derived from the material ratio curve. The Rk parameters help us describe how a surface will wear, support a load, retain lubrication, etc. A single number cannot describe all of these traits...but the Rk parameters can.
Read More
Check out the “2D & 3D Parameters” podcast
Digital Metrology's Mark Malburg was a guest speaker on Zygo Corporation's recent podcast, "2D and 3D Parameters: Should you stick to the typical results?" Dr. Malburg and Carl Musolff, retired senior technical advisor from Cummins Corporation, joined host Tyler Kern to discuss how surface texture parameters are specified and measured in order to control component quality.
Read More
Notepad Series Video: The Material Ratio Curve
In "The Material Ratio Curve" we look at this rather well-known curve (historically known as the Abbott-Firestone Curve). It shows us the amount of material that we encounter as we move further down into a surface. That can tell us a lot about the surface: how durable it may be, how it could carry lubrication, how well it may wear...even how comfortable it may be to slide around on (not recommended!).
In this introduction we show how the material ratio curve is derived. Then, we show you some examples that will help you estimate the nature of a surface from the shape of its material ratio curve.
Read More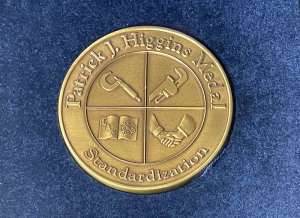
Mark Malburg Honored with Higgins Medal
Digital Metrology's Dr. Mark Malburg recently received the 2020 Patrick Higgins Medal. The annual award is presented to an individual who has contributed to the enhancement of standardization through contributions to the development and promotion of ASME codes and standards or conformity assessment programs.
ASME codes are recognized throughout the world for their excellence. The Standardization group is one of the senior code writing bodies within ASME, with publication dating back over 100 years ago. The Higgins medal was established in 2006 to recognize voluntary codes and standards activity in the Society.
The award is named for Patrick Higgins, who chaired ASME's A112 Committee on Plumbing Material & Equipment for over eighteen years. He also served as a Vice President of C&S Standardization.
Read More