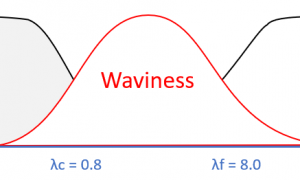
What kind of waviness?
For many industries, waviness is a critical aspect of surface texture. The presence of waviness on a surface can be directly connected to functional problems such as noise, vibration, excessive wear and sealing issues. So, if we are going to control waviness, we need to first understand that there are two different interpretations of waviness
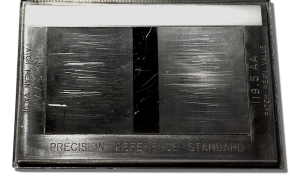
Understanding that scratched-up calibration patch
In many laboratories and production environments, we encounter surface texture calibration patches that look like this. Hopefully yours don’t look quite this bad, but let’s take a deeper look at this damage. Calibration patch surfaces are typically made of electroformed nickel, so they can be relatively soft. As a result, we often assume that the
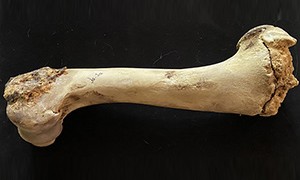
Surface texture analysis for the sciences
If you work in manufacturing you likely think of “surface texture analysis” as a tool for quality control or for improving functionality. But there are many applications beyond the factory walls in which surface analysis can lead to new discoveries or new ways of looking at the world. Carrie Rowe is a doctoral candidate in
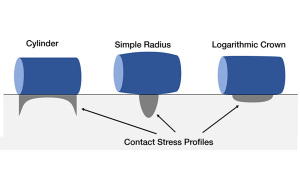
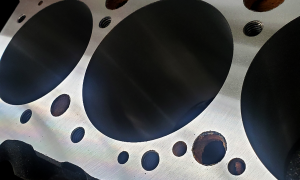
Analyzing crowned profiles with CrownView
In many applications, crowned profile geometries are employed to optimize load carrying and durability. As an example, crowned profiles are used in roller bearings to control local contact stresses. As the image below shows, the shape of the roller bearing surface relates to the stress pattern that develops when the bearing is pressed into its
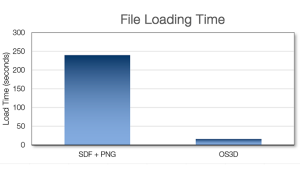
The OmniSurf3D data file format
Digital Metrology wants you to be able to access and explore your data as easily as possible. After all—it is YOUR DATA. Recently Digital Metrology created the OmniSurf3D data file format (*.os3d) for efficient storage, reading, and writing of surface topography data. This file format is portable across operating systems and can be coded directly
Image overlays in OmniSurf3D
You’ve heard the saying, “a picture is worth a thousand words.” This is very true in the analysis of 3D (areal) surface texture. While parameters with numerical values offer some degree of understanding… a picture can often be more instructive.* The false colors in this 3D surface map (from our OmniSurf3D analysis software) indicate the
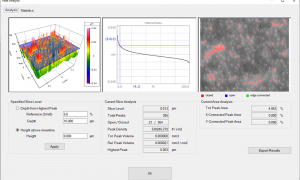
Peak Analysis tool in OmniSurf3D
If you work with coatings, electrical contacts, sliding surfaces, substrates for painting, etc., you know that controlling surface peaks can be the difference between a functional part and a failed one. The Peak Analysis in OmniSurf3D is an interactive tool for visualizing the peak material. Click and drag the cutting plane on the Material Ratio
Read our “Hidden Waviness” article in Quality Magazine
Our new article, “Hidden Waviness: When measuring roughness cannot solve quality challenges,” appears in the June 2020 issue of Quality Magazine. This article was written in conjunction with Don Cohen of Michigan Metrology. Specifications for surface texture frequently focus on surface “roughness”—the finer structures in the texture—often to the exclusion of the “waviness”—the larger structure
How big is that 3D dataset?
When we look at an areal (3D) measurement of a surface it can appear as a vast landscape of many sizable features: An optical, areal measurement typically includes millions of points. On the other hand, a stylus-based, 2-dimensional measurement typically includes just thousands of points. But just how big are the areas covered by these