
Explore and understand your measurement data
Digital Metrology provides innovative measurement software, custom-tailored metrology systems, consultation and training to help you acquire and apply your measurement data. The value of metrology isn’t in the results—it’s in how you interpret the data. We help you get the information you need, then apply it to solve challenges in R&D, product development, and production.
Mark C. Malburg, Ph.D. Digital Metrology Solutions, Inc.
News
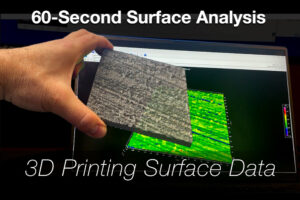
60-Second Surface Analysis – 3D Printing
With OmniSurf3D surface texture software you can easily generate STL files to 3D print your surfaces. This video shows you how it's done.
Digital Metrology’s always been committed to helping you see and explore your surfaces. While seeing your data takes you well beyond the numbers, a surface you can hold in your hand is maybe the most helpful visual aid of all! Read More
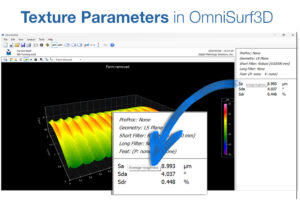
60-Second Surface Analysis – Parameter Help in OmniSurf3D
Surface texture parameters tell us a lot about a surface and how it will perform. OmniSurf3D gives you access to dozens of parameters...and more important, it helps you keep them all straight as well! Find out how in this 60-Second Surface Analysis video.
And, check out our new Texture Parameters video series as well for fast, graphical explanations of important parameters. Read More
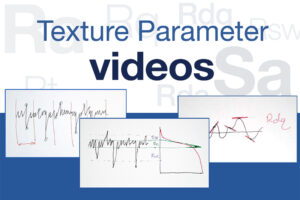
New! Surface Texture Parameter Videos
Surface texture parameters tell so much about a surface and how it might perform. But just looking at the equations can’t tell us everything we need to know about how to interpret the values.
This new, free series of videos helps explain the meaning of dozens of common surface texture parameters in a simple and graphical way. If you’re a fan of the Notepad Series, we think you’ll find these new videos helpful as well! Read More
Averaging results with TraceBoss and TraceBoss+
You probably know how easy it is to collect surface roughness measurement data with TraceBoss and TraceBoss+. But if you have a lot of measurements, how can you average the results? It’s actually really simple—this video walks you through the steps! Read More
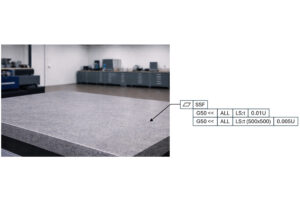
ASME Y14.49: Part 3: The Surface Plate Problem
This is the third part of our blog series showing how to put the new ASME Y14.49 standard to work for you for better GD&T controls. Read More
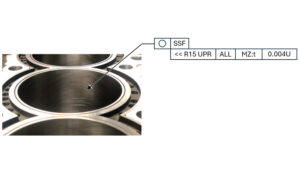
ASME Y14.49 Case Study #2: The Cylinder Bore – Ring Interface
This is the second part of our blog series showing how to put the new ASME Y14.49 standard to work for you for better GD&T controls. Read More
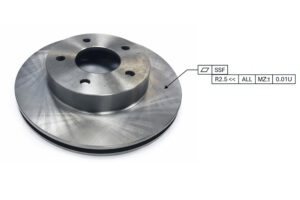
ASME Y14.49 — a major improvement to GD&T!
The new ASME Y14.49 standard unlocks the potential for better GD&T controls! In this blog series we'll show you how to put this new standard to work for you. Read More
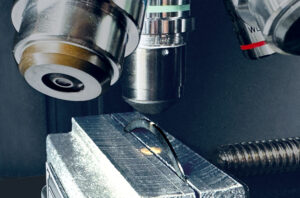
Measuring a piston ring
Measuring the edge of a piston ring poses a lot of challenges. It's a very narrow surface, with random pits, and scratches around the circumference as well. We recently showed some applications where measuring with a stylus may be the best option...here's one where a 3D optical measurement proves to be the winner. Read More
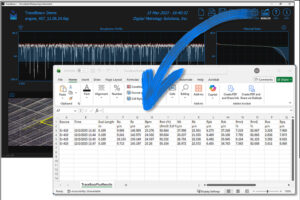
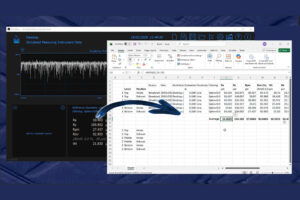
60-Second Surface Analysis Video – Saving TraceBoss Data to an Active Spreadsheet
In TraceBoss and TraceBoss+ you’ve always been able to export your calculated parameters directly to a spreadsheet. Now, you can also save them to an active spreadsheet. This 60-Second Surface Analysis video shows you how it's done! Read More
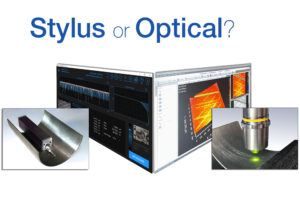
Thinking of “upgrading” from a stylus? Think again!
“Why would you use that antique measuring system? Today we have optics!”
Measuring with a stylus can seem low tech or even old fashioned…but in fact, both stylus and optical technologies have their place, and which one is “best” depends entirely on the application. Find out more in this Surface Notes blog post! Read More