In surface texture, Average Roughness (Ra) is still the most widely used parameter, even though it has serious limitations. But what other tools are there that can tell us more about our surfaces? We’ll be exploring that topic in a series of posts, so watch this spot for updates every week!
Looking for more info? Check out our original “What’s Really Beyond Ra” post!
Let’s start with our favorite way to move “beyond average roughness:”
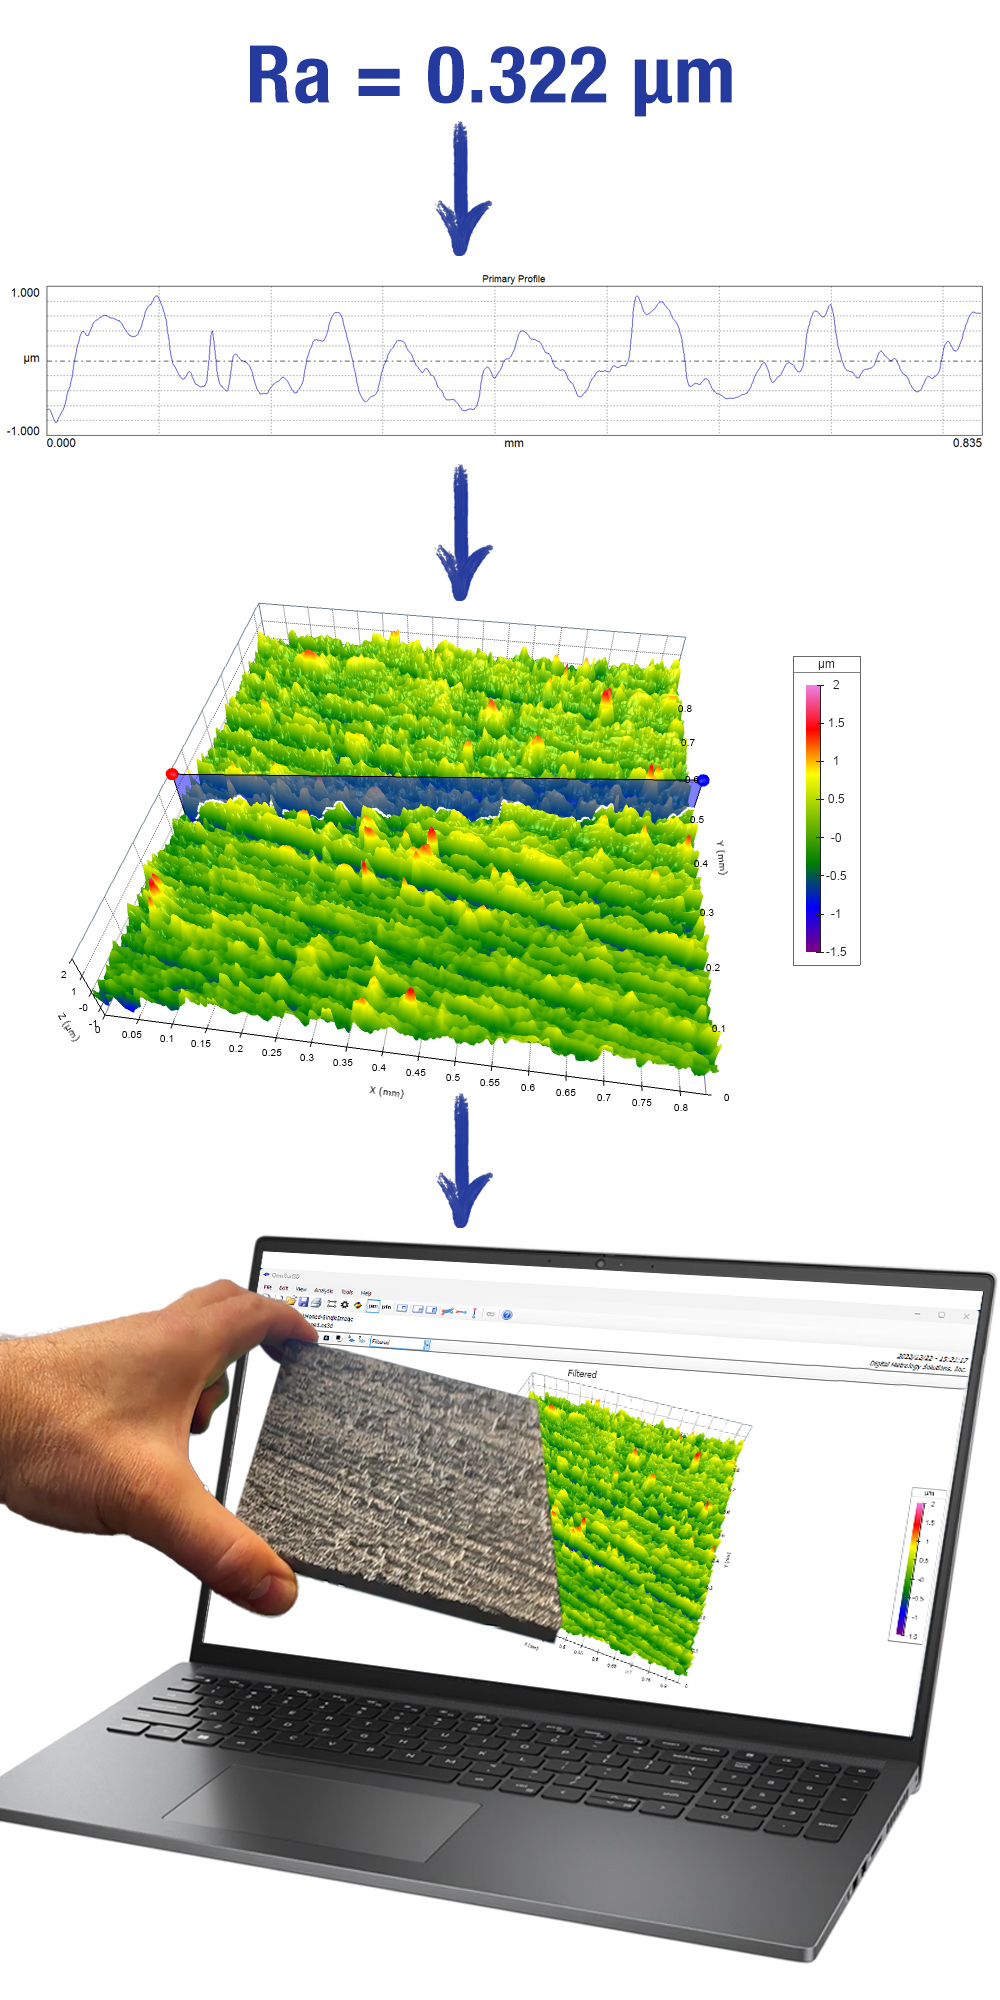
1. SEE the data.
For most of us, music notes on a page aren’t really a song until we hear them played. It’s the same with surface texture: parameters are just numbers until we can see what they’re trying to tell us.
A 2D profile shows a lot more about a surface than just a few numbers. A 3D image takes it to still another level, showing trends in all directions. And these days you can even 3D print data so you can hold it in your hand.
But, of course, our eyes can play tricks on us, too. Are those actual spikes in the measurement data, or maybe just measurement noise? Is the surface really tilted, or is the data skewed by a few bad pixels? Seeing a surface is a powerful aid, but there are many more tools in the toolkit as well…
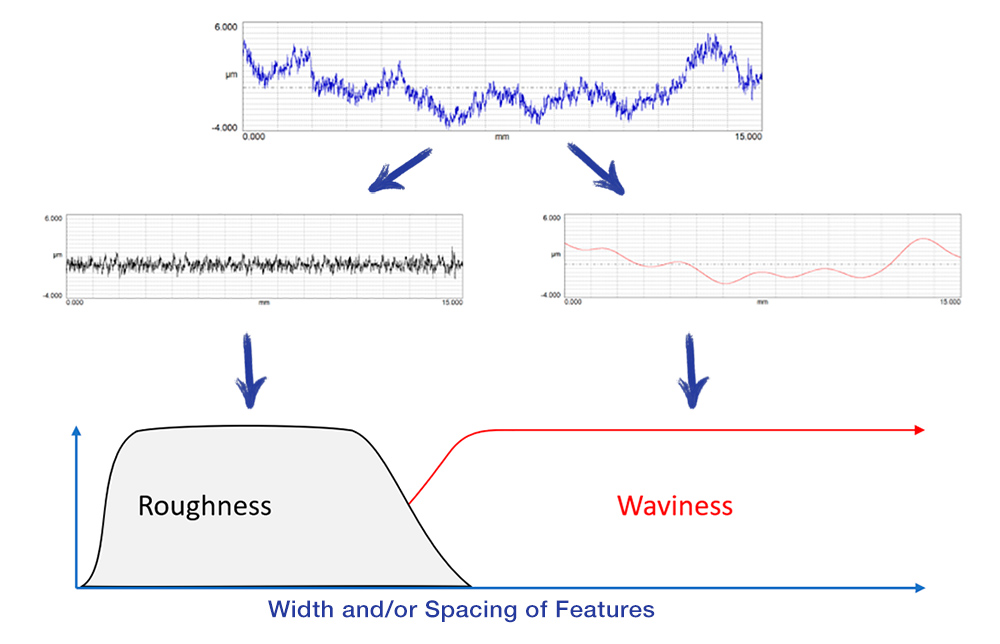
2. Waviness
Average roughness (Ra) describes the finer features in surface texture. The larger shapes that we call “waviness” can be just as impactful. Waviness may be the source of noise, vibration, and harshness in gears, as well as the cause of leaky gaskets, premature wear, stress concentration, and many other issues.
The trouble is, roughness parameters like Ra don’t tell us anything about the waviness. It’s like describing a roller coaster by talking about the grain of the wood: you won’t get any sense of the humps and dips that make the roller coaster fun! Check out our Notepad Series videos, Roughness and Waviness and Specifying Waviness to learn more.
3. Wear Analysis
To gauge how much a part is wearing, it’s tempting to measure the average roughness (Ra) of the surface before and after use, then treat the difference as “how much the part has worn.”
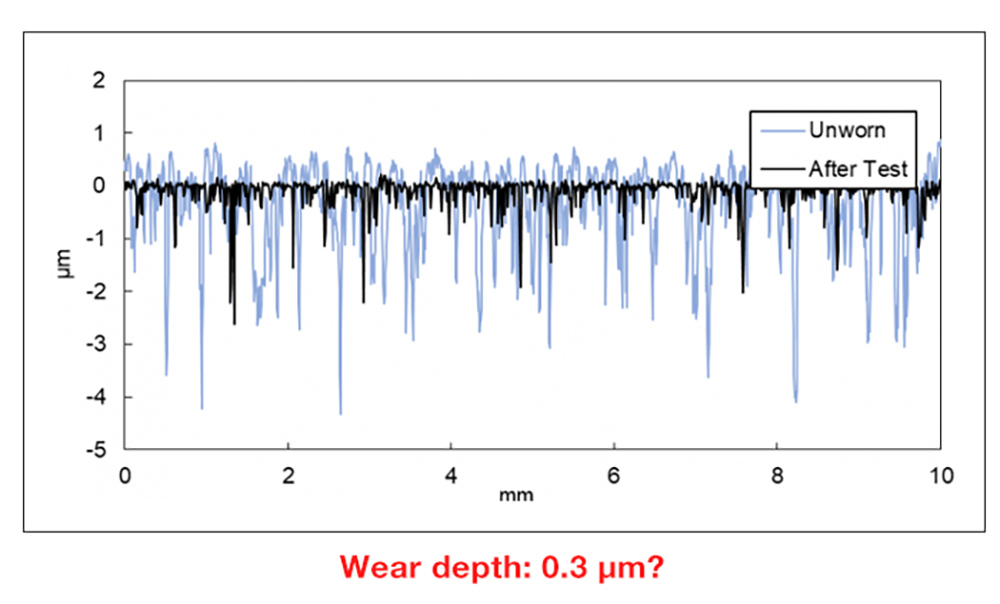
That’s a lot like digging a hole and trying to judge its depth by measuring the amount of roughness at the bottom!
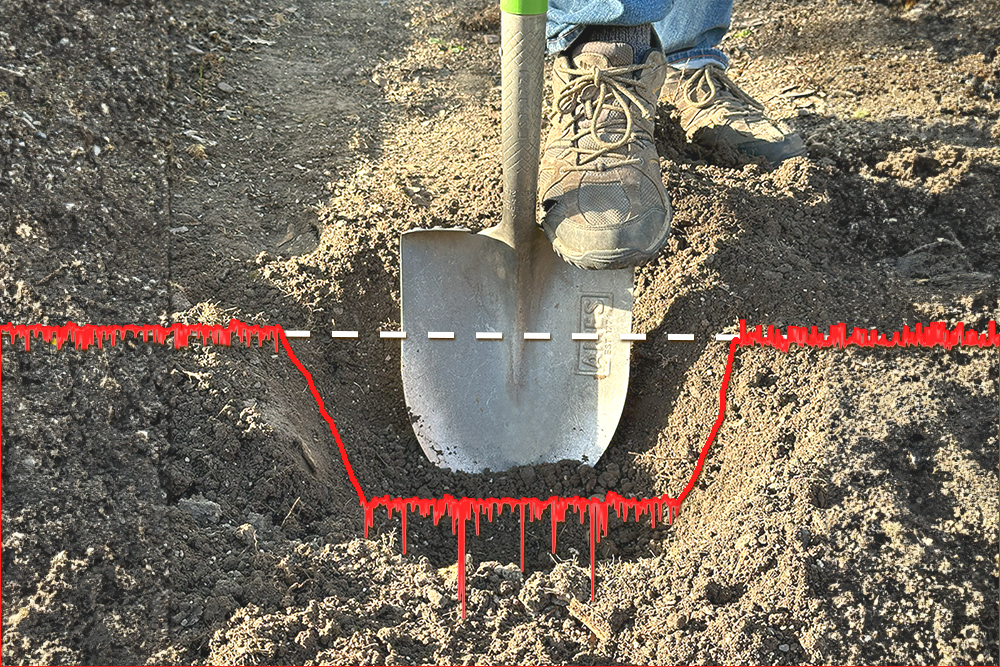
To measure wear properly, we need to have a reference from the original surface. In the case of a hole, we can use the “ground” around the hole as the reference and measure the difference between the “before” and “after” depth.
In the case of “micro-wear”— the wear within the original texture—we need to match up the unworn valleys. We can do that by shifting the worn surface up and down relative to the unworn surface.
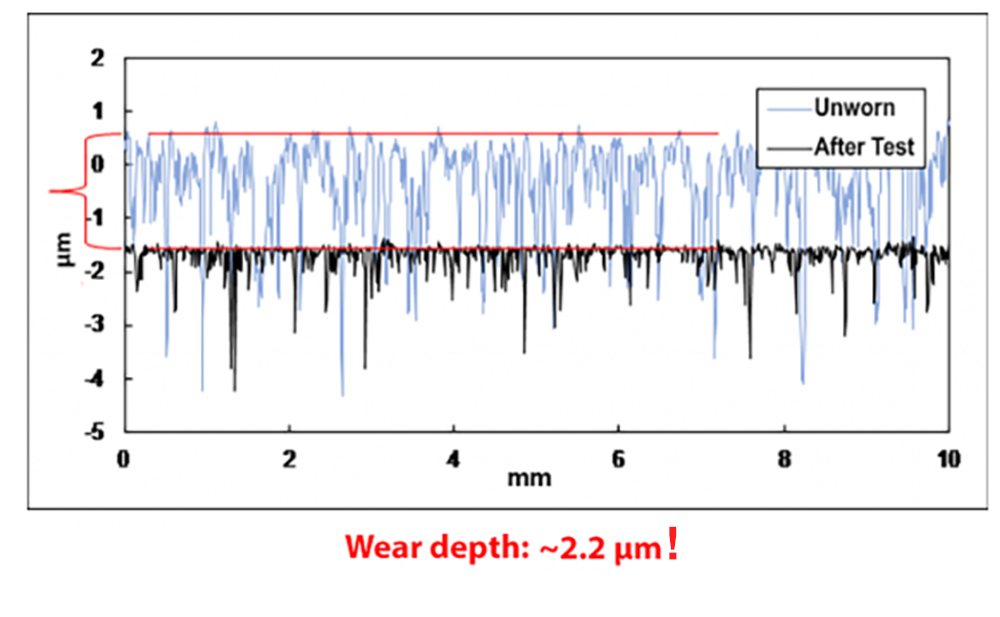
Got a wear issue? Talk to us about how to approach it! Want more details about analyzing “macro” and “micro” wear? Read more in this wear analysis blog post.
4. Ra by Wavelength Bands
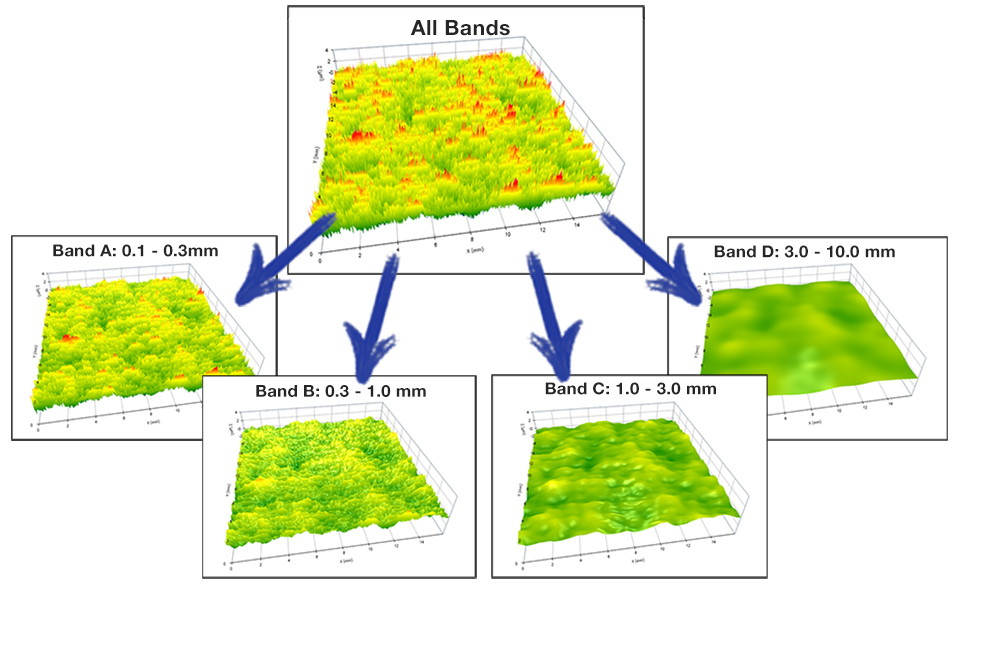
Average roughness doesn’t always help to describe how a surface looks. Appearance may be affected by features of one particular scale (i.e., wavelength) more than others. In a paint finish, for example, excessive roughness at very short wavelengths may result in haze, or dullness.
Even though the total Ra may not be helpful, comparing the average roughness (Ra or Sa) over narrow bands of wavelengths can help differentiate “good” from “bad” finishes. Monitoring Sa over several wavelength bands can help manufacturers dial in an exact finish. Digital Metrology’s Bandify and Bandify3D software are made for this kind of multi-band analysis.
5. Slopes
Our eyes can detect subtle differences between surface finishes. But height parameters like average roughness may not “see” what we see, because the difference between textures aren’t always difference in heights.
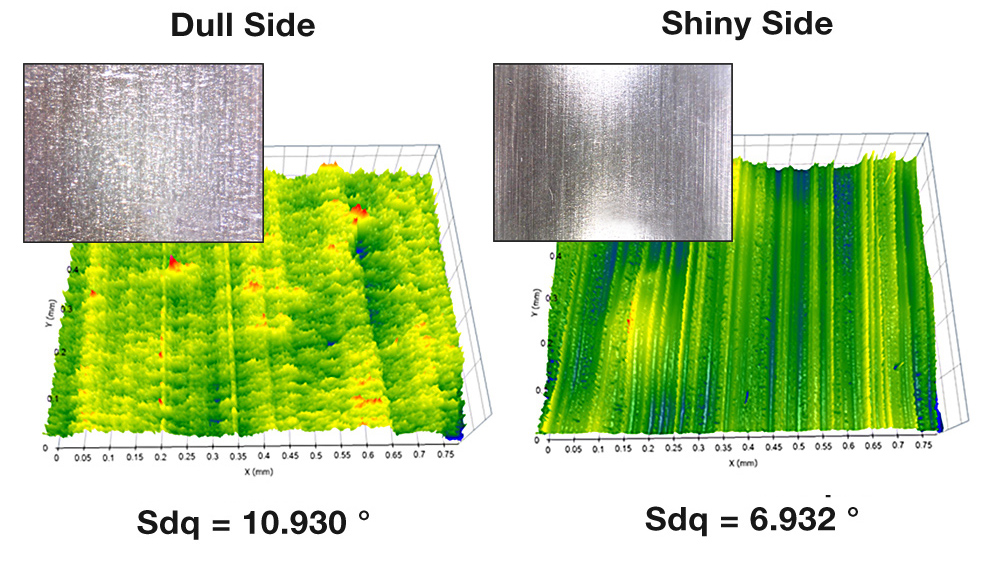
The slopes in the texture can impact how light scatters on the surface, which will change how the surface appears. The Sdq parameter is a measure of the slopes in surface texture, and it can often differentiate surfaces that Ra/Sa cannot. Sdq is a standard parameter in our OmniSurf3D software.
The dull and shiny sides of aluminum foil, for example, have very similar average roughness values, but very different Sdq values.
6. Rk Parameters
Can one parameter like average roughness predict how a surface will support a load, retain lubrication, and wear? The short answer is: no. But the Rk family of parameters can help.
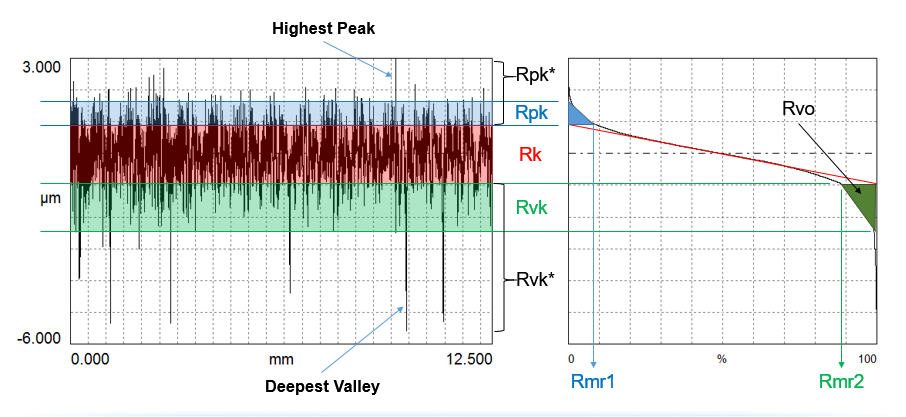
The Rk parameters are derived from the material ratio curve, which represents how much material we have at varying depths as we slice through a surface. Three of the primary parameters in the Rk family are:
- Rk, the peak-to-valley height of the core material. This is the running surface, which will likely support a load.
- Rpk, the effective height of the peak material. Controlling the peaks may be important for applications involving sliding surfaces. It is also the portion of the surface that may be most affected by break-in.
- Rvk, the effective depth of the valley regions below the running surface. The valleys may be important for retaining lubricant and/or moving debris out of an interface.
The Rk parameters are well-suited to describing plateau honed surfaces that have distinct plateaus, core, and valleys.
How the material is distributed between peaks, valleys, and core affects many surface functions. In a combustion engine, for example, controlling the Rk parameters for the surface of a cylinder bore is essential for efficiency, gas consumption, emissions, and wear.
There’s a lot to learn about the Rk parameters! The Rk Parameters Notepad Series video is a great place to start.
See how the parameters are applied to produce efficient engines in this Plateau Honed Surfaces tutorial.
7. Rz
Our eyes are good at figuring out how “generally” rough or smooth a surface is. You can look at a lawn, say, and gauge how tall the grass is, despite one or two tall weeds or deep divots.
The Rz parameter, or 10-Point Average Roughness, tends to “see” more like our eyes do. To get Rz, we divide a profile measurement into equal segments (the segment length is often equal to the roughness cutoff). We find the difference between the highest and lowest point in each segment, then average them together.
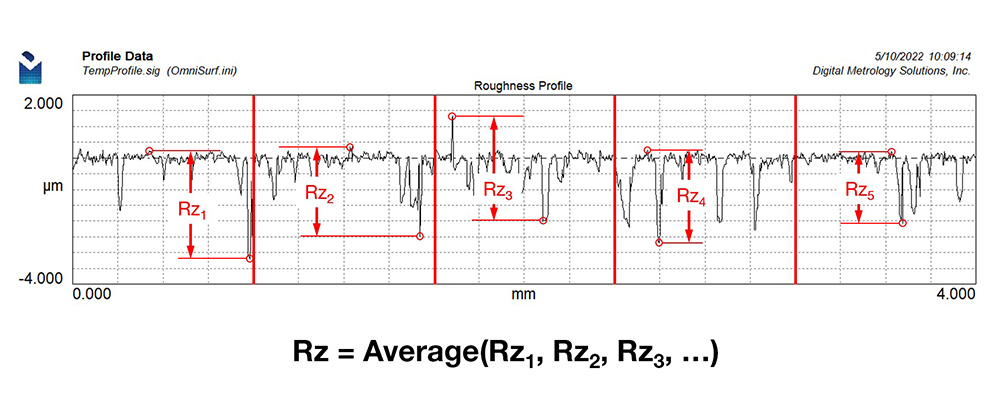
Rz is easy to measure, so it’s no surprise that, after average roughness (Ra), it’s the second most commonly specified parameter. Rz can give a quick, general evaluation of surface roughness. In a production environment it can be useful for spotting changes in a process over time.
Unfortunately, like Ra, Rz is susceptible to outlying data points such as dirt or deep pits, which can skew the data and make the parameter unstable. As with Ra, very different surfaces may have the same Rz value, so it cannot always discern the differences that affect how surfaces will function.
Very different surfaces with similar Ra and Rz values.
One last note on Rz: most standards, including the ISO and ASME standards, agree on the 10-point definition described above. An older definition, from Japan’s JIS standard, averages five peaks and valleys per segment, as opposed to five peak-to-valley differences total. While this “JIS” definition is outdated, you may still encounter it. so make sure that you are calculating it correctly.
Want to know more? Check out our Notepad Series video showing how Rz is derived.
You can also learn about the Rz parameter and its uses in the Surface Texture Answer Book.
8. Interact with data
Roughness parameters like Ra (average roughness) are a first step in understanding surface texture. Seeing the data offers another level of insight into how a surface might function.
A third step, interacting with data—spinning it, zooming it, changing settings in real time—can lead to insights that numbers alone may not give us. Software tools like OmniSurf and OmniSurf3D let you explore the surface and often provide the “why” to go along with the “what” we learn from parameters.
9. Wavelength Content
Sometimes the kind of “roughness” is as important as the amount of roughness.
Surface texture consists of a spectrum of wavelengths, ranging from short wavelength roughness to longer wavelength waviness and form.
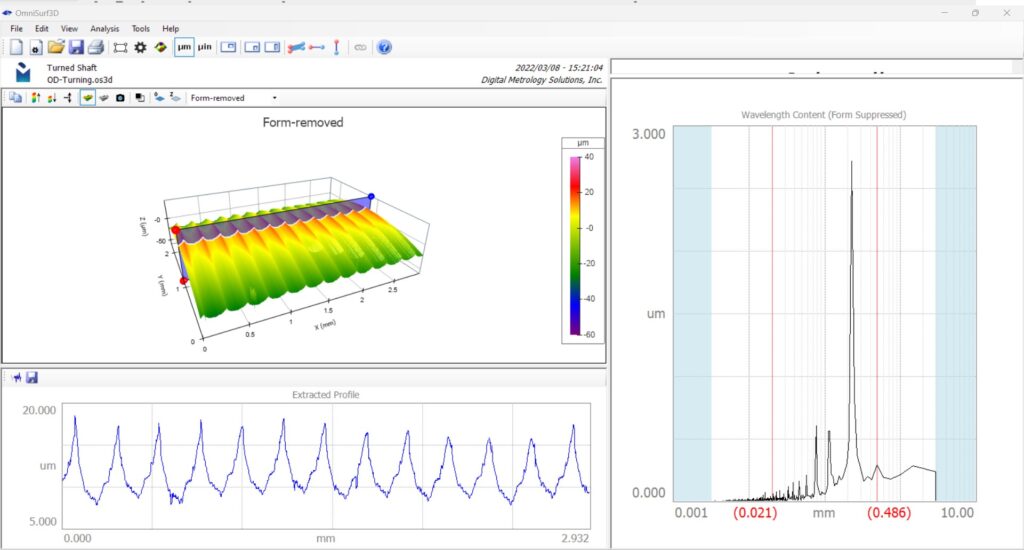
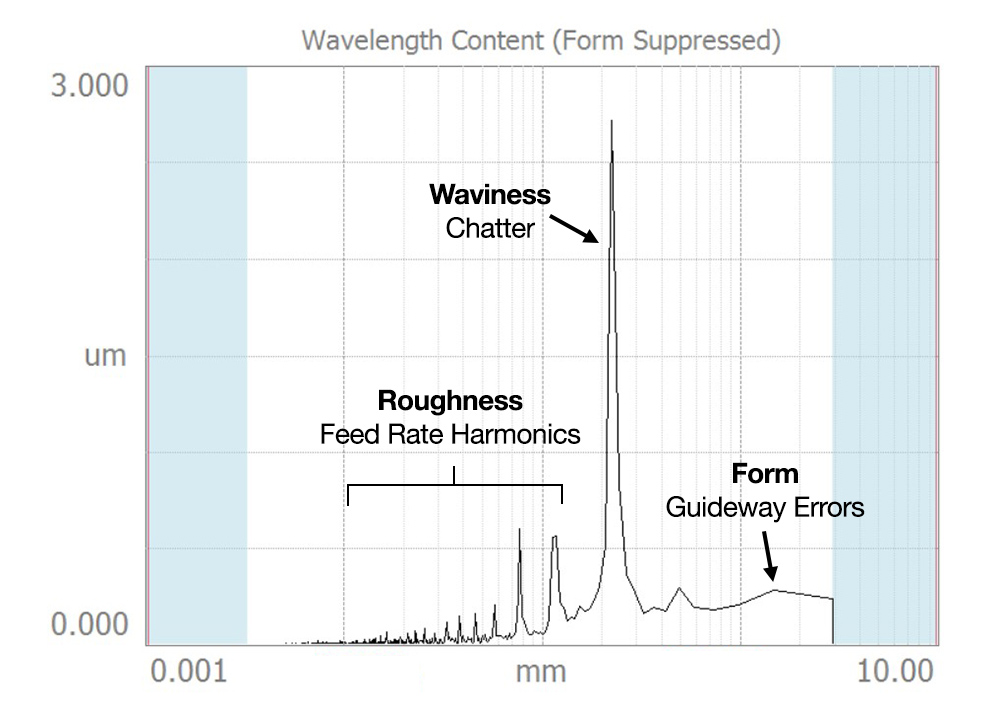
Tools like the Wavelength Content Graph in Digital Metrology’s OmniSurf3D software can show you the prominent wavelengths in a particular texture. Below is a turned surface, with a 3D plot and a 2D cross section. The wavelength content graph is on the right. Its x-axis shows the spectrum of wavelengths, while the y-axis shows the amplitude, or strength, of the texture at each wavelength.
As an example of how the wavelength content graph works, here is a surface with periodic texture:
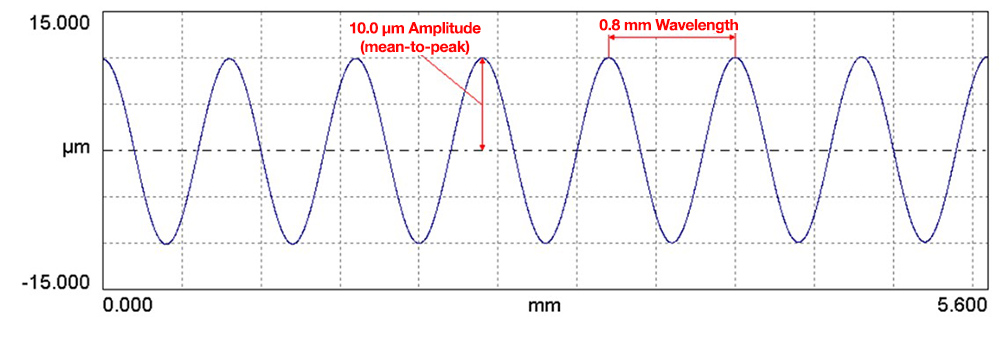
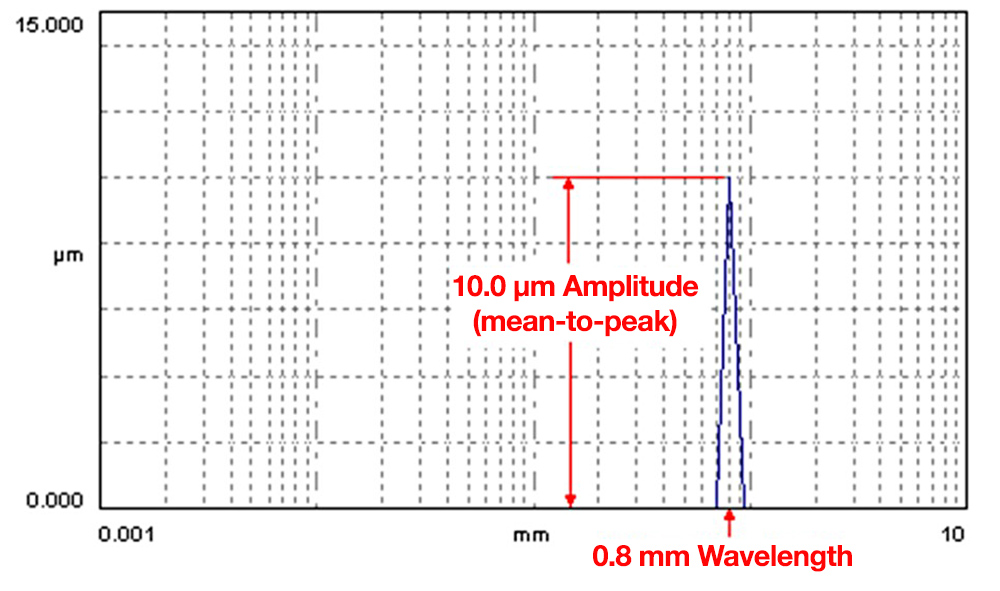
For that surface, the wavelength content graph will show a sharp spike coinciding with the period of the texture.
Now, let’s take a closer look at the wavelength content graph for the turned surface we showed above. Here’s how some of the texture features might relate to real-world causes.
10. Rq
A surface texture is a distribution of heights. Very often, this distribution forms a classic “bell curve” shape…and when we see a bell curve, we typically use the “standard deviation” to describe it.
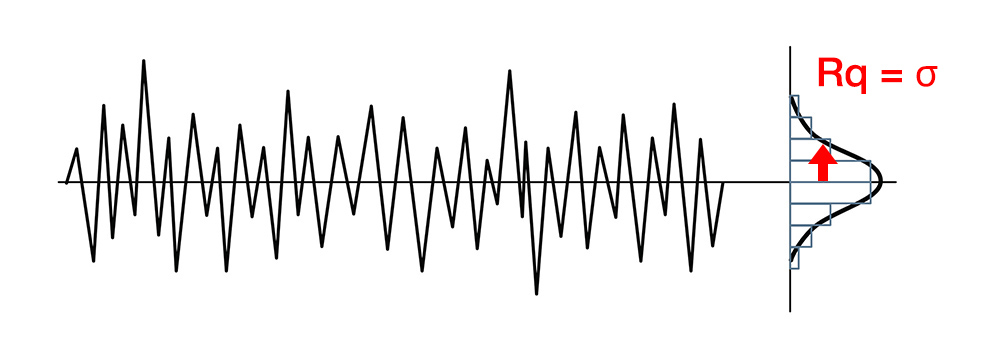
For surface texture, Rq is the standard deviation of the measured heights. Specifically, Rq is one standard deviation of the distribution of profile distances from the mean line, as shown below.
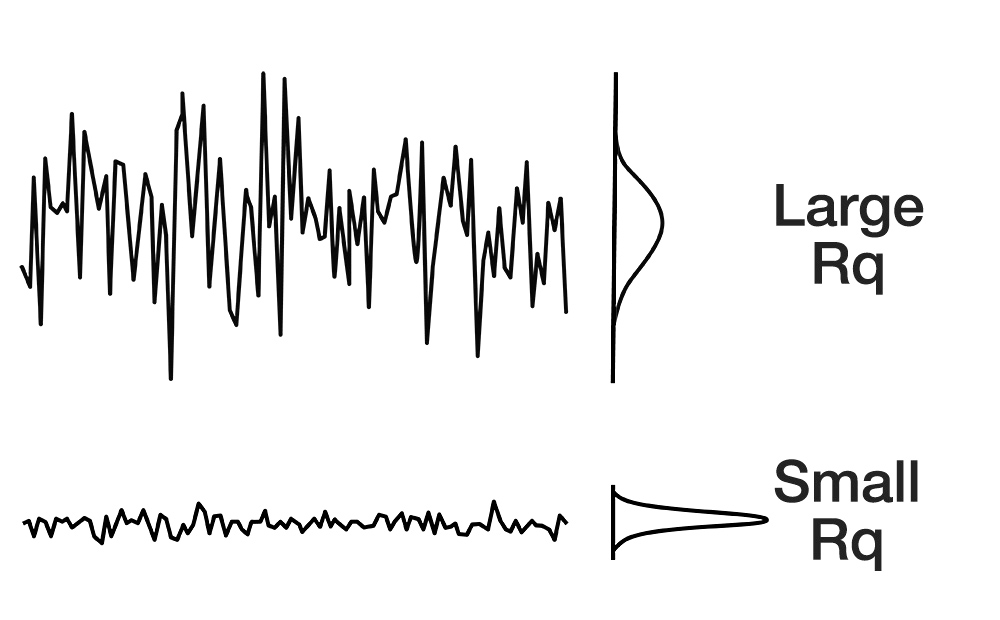
You may also see it written as σ, or as the RMS (root-mean-square) roughness.
A surface with a wide distribution of heights will have a larger Rq value, while a surface with a smaller distribution of heights will have a smaller Rq.
Given the statistical nature of Rq, it is often considered to be more useful than Ra for mathematical modelling in research areas such as lubrication and film thickness prediction, as well as surface appearance and surface contact modelling. Nonetheless, Rq is still based on combining all of the points along the surface, and as such, it has the same limitations as Ra.
While Rq may not be “better” than Ra in many cases, it does lead us to a very useful set of parameters, the “Q parameters,” which we will introduce next.
11. Q Parameters
In our last post we introduced the Rq parameter, the standard deviation of surface heights. Rq is the basis for the Rq parameters or Q parameters), which are very useful for understanding highly plateaued surfaces, like we might find in engine cylinders.
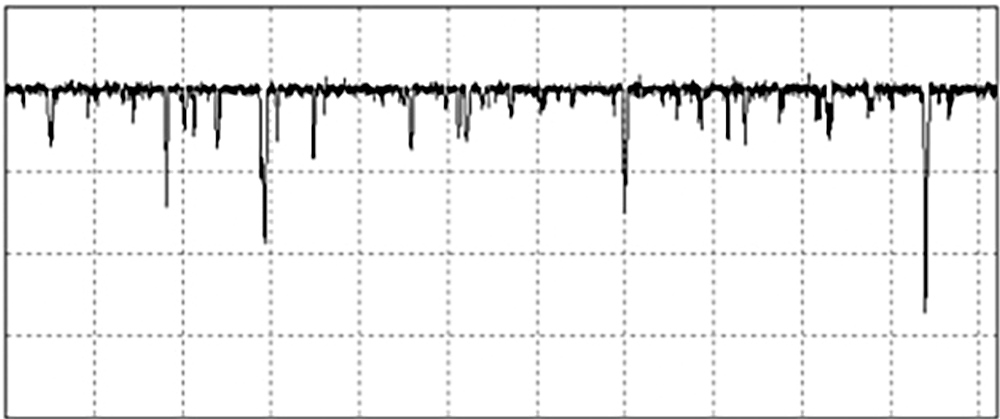
Here is an extremely plateaued surface, created by a coarse honing operation followed by a finer hone that creates the plateaued region:
The image below shows the distributions created by the valley-making process (blue) and the plateau process (red). When we plot Rq for these regions on a special “probability” scale, we get the graphs at the right. The combination graph, which looks much like the material ratio curve, is called the Material Probability Curve.
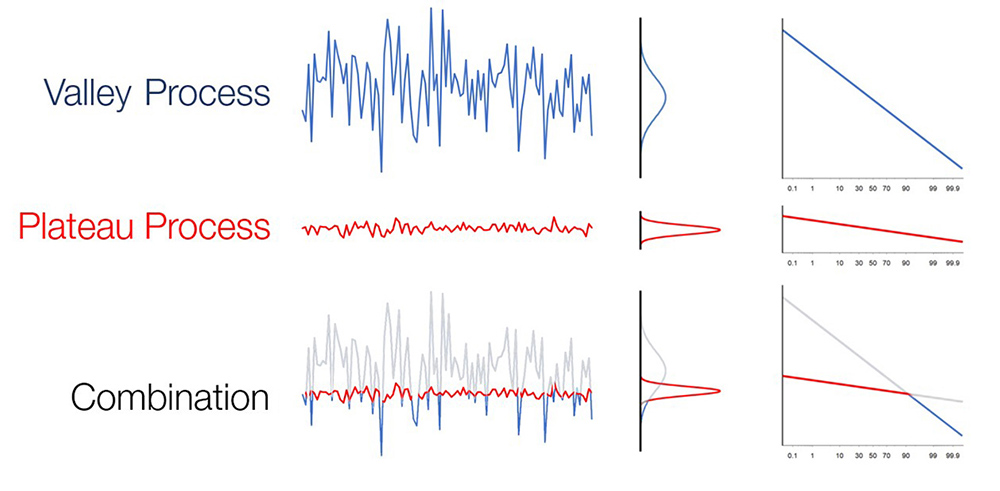
The Q parameters (Rpq, Rvq, Rmq) derived from this curve are robust for distinguishing the plateau and valley regions—critical information for controlling the honing processes that create extremely plateaued surfaces.
To learn more about the Q parameters, check out this Notepad Series video.
This tutorial walks through all of the parameters that are used for controlling plateau honed surfaces.
12. Morphological Filters
Like many surface functions, “sealing” can’t be measured purely in units of height. Yet, the most common texture parameters specified for sealing surfaces are based solely on heights measured along a profile, including average roughness (Ra), average peak-to-valley height (Rz), and total waviness (Wt).
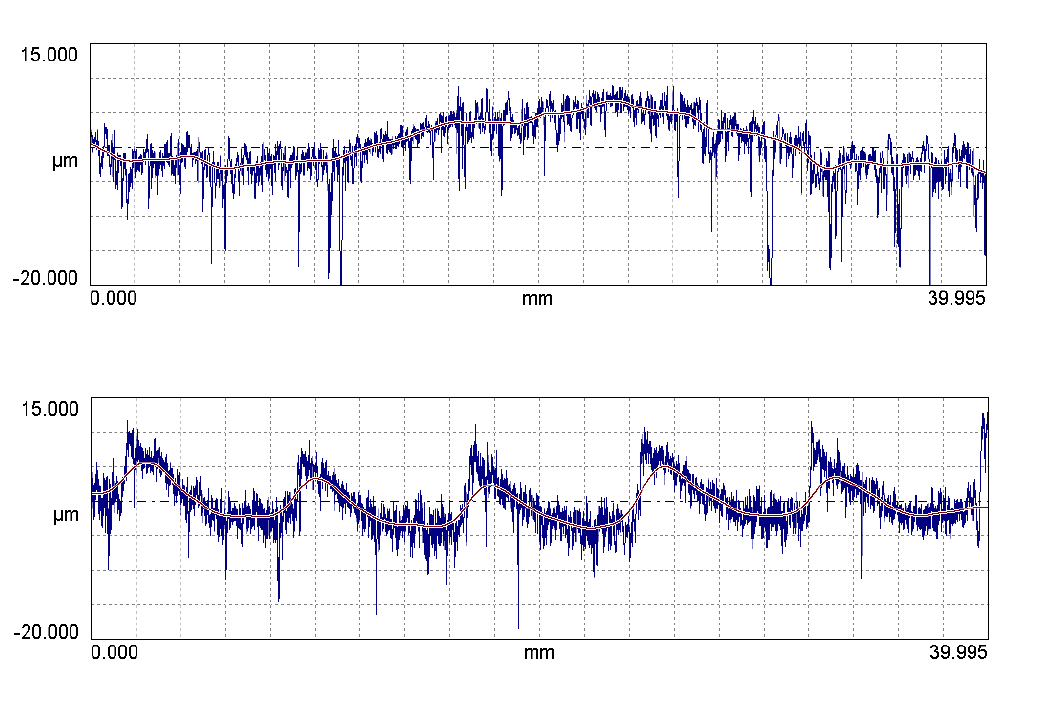
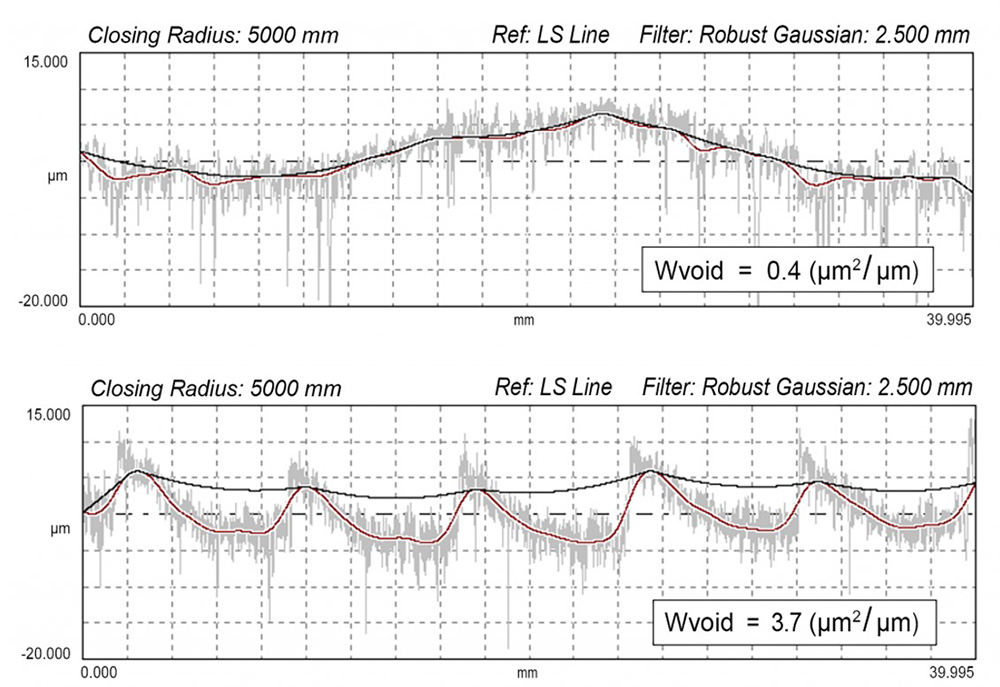
Here are two very different surfaces with virtually identical Ra, Rz, and Wt values. However, none of these parameters would reveal that the milling pattern in the second surface may have created a series of leak paths.
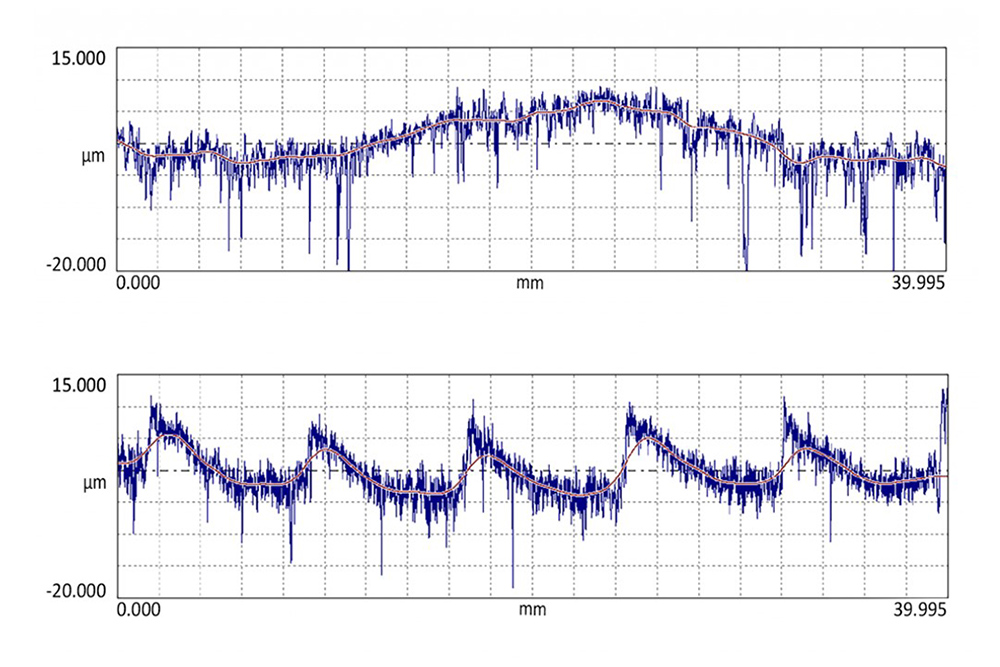
A morphological “closing filter,” on the other hand, can simulate the shape that a gasket would follow. By rolling a mathematical ball or “disk” over the surface, this filter produces a “virtual gasket” that follows the peaks but can’t enter the steep valley regions where a gasket may not conform. As a result, it can highlight the regions that are not touched by the gasket and can therefore be related to leaks.
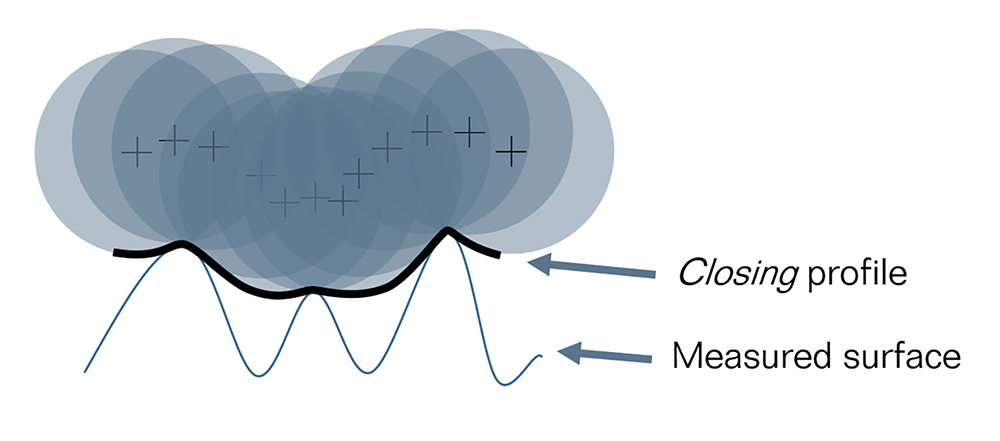
Here are the two surfaces that we saw above. Their waviness profiles are shown below in red. Applying a closing filter with a radius of 5000mm creates the profile shown in black—revealing the voids in the second surface that a gasket may not be able to seal.
A crucial aspect of morphological filters is that they can be adjusted in real time in software such as OmniSurf and OmniSurf3D, letting engineers explore how changes in materials, processes, and tolerances might improve performance. Changing the radius of a closing filter, for example, makes it possible to model more and less compliant gasket materials.
For more on how morphological filters can be applied, check out the “will your sealing surface leak?” post in our Surface Matters blog.