Years ago just about every discussion about surface roughness began with Average Roughness, Ra, one of the oldest and most widely known texture parameters. More and more, however, when I start working with people, they begin by telling me that they know Ra is not all it’s cracked up to be. Many articles have been written on its shortcomings. And, many of the people I discuss texture with have experienced firsthand how processes have changed, or parts have failed, despite the Ra value still meeting spec.
Looking for more info? Check out our “Beyond Average Roughness” series.
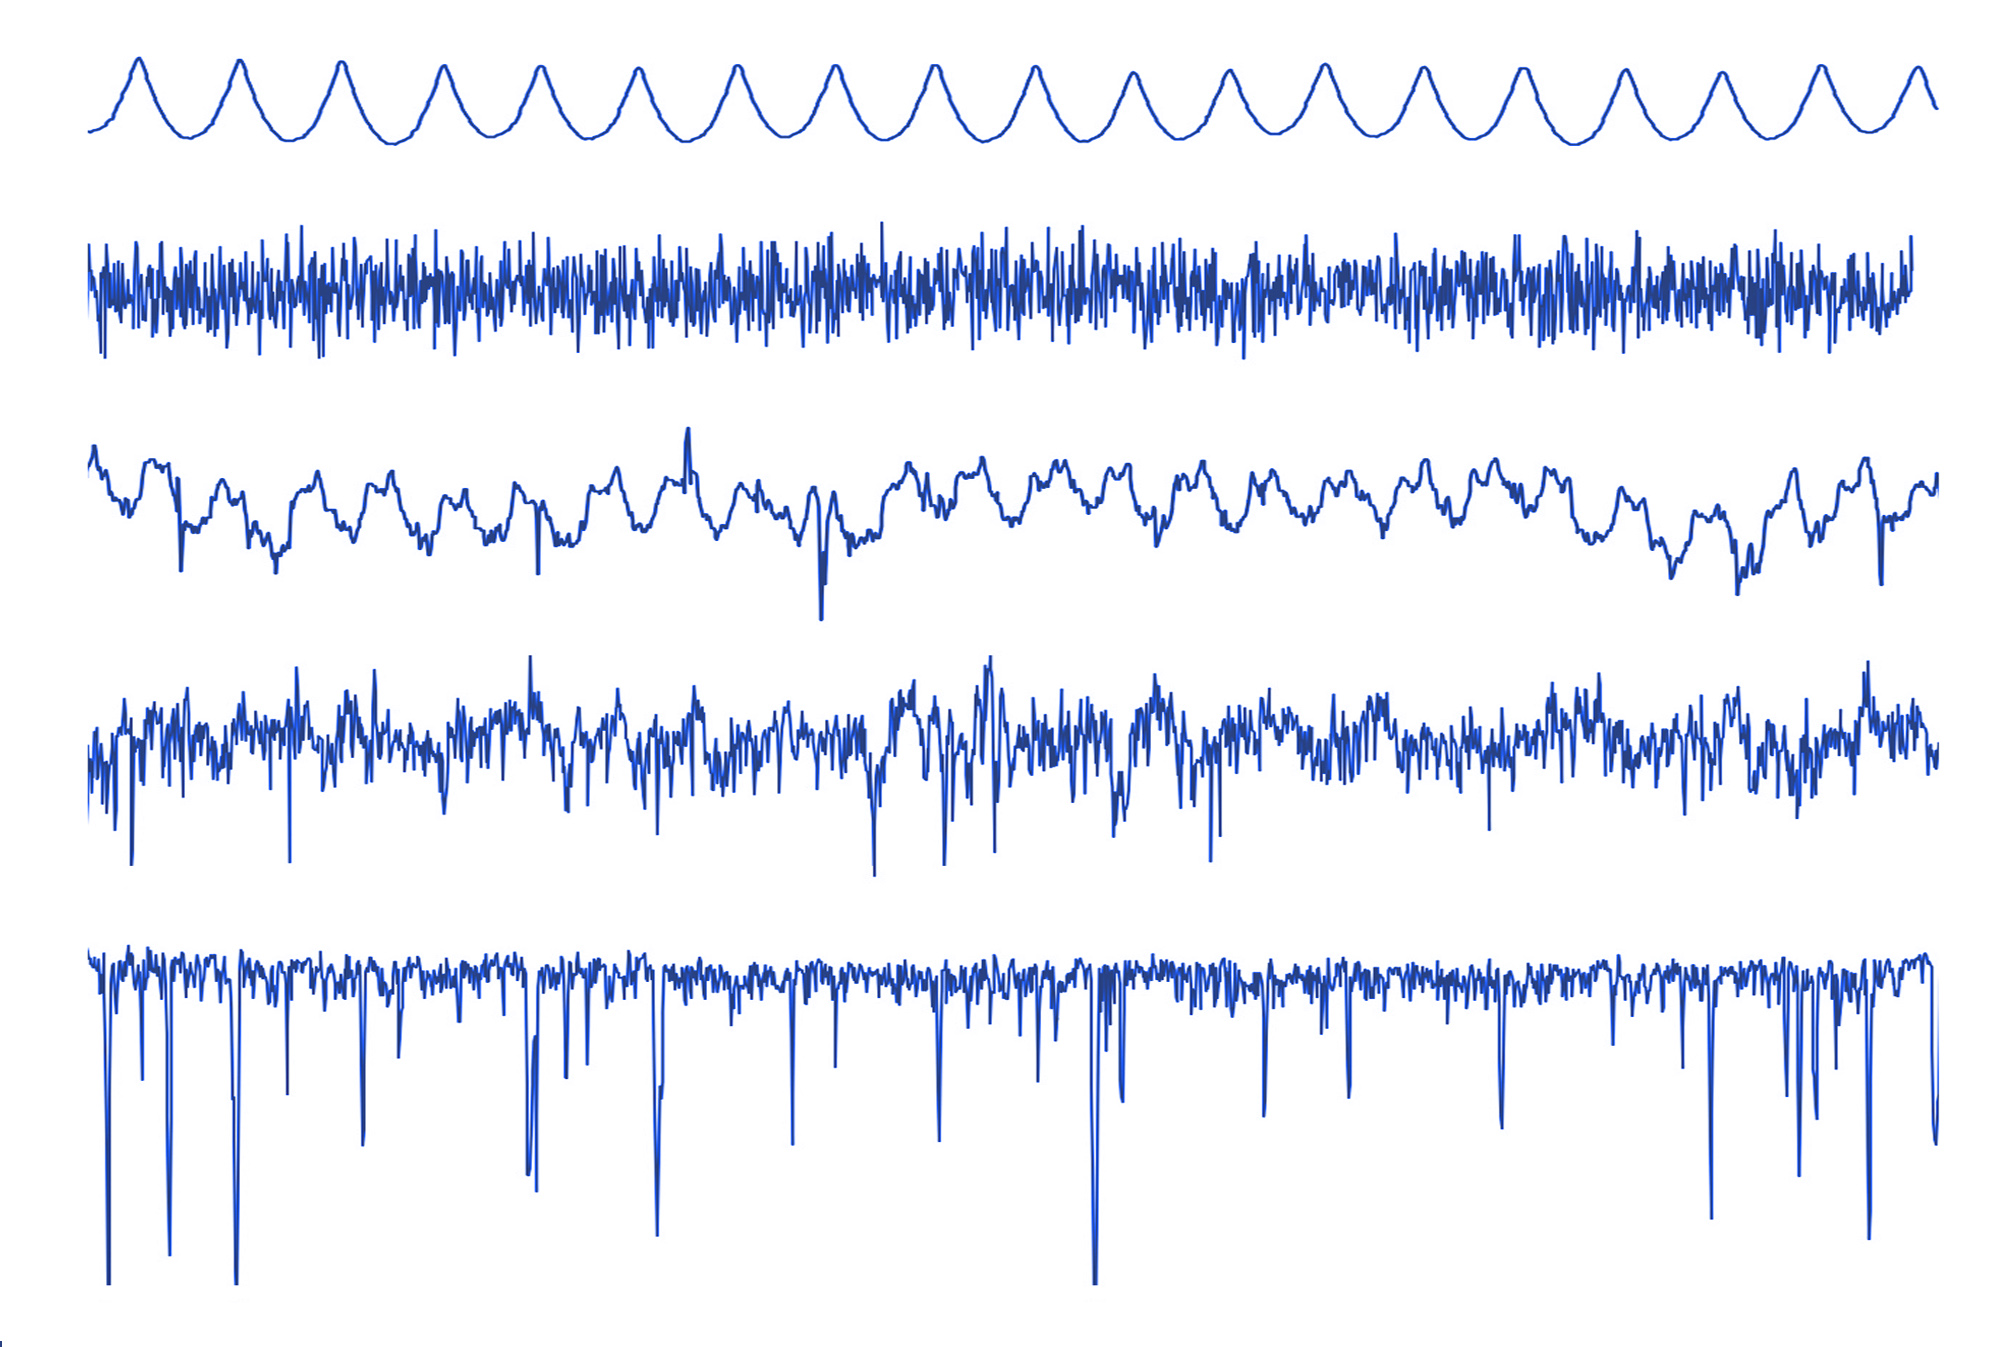
The Ra (average roughness) parameter provides similar values for all of these very different surfaces.
We know that the old way of measuring roughness is inadequate to control a process or to really describe a surface. But the question remains: if not, Ra, then what? How do we describe surface texture in a more meaningful way?
Parameters? A start.
For the last decade many articles have been written describing parameters that provide more repeatable and, to an extent, meaningful numbers than Ra (or Sa, its areal, 3D counterpart). Height parameters, spacing parameters, shape parameters and hybrid parameters describe, in great detail, aspects of texture that may be important for a given application. These results, however, all describe a surface mathematically: the number of high points, the steepness of the slopes, the width of the spacings. It’s important information, but still very abstract, and it requires a large amount of interpretation to decide whether the numbers mean a gasket will leak or seal, whether a brake will squeal, etc.
A parameter value is important data…but on its own it does little to explain the qualities of a surface.
Could you draw a picture of this surface given only the number?
Functional parameters have been developed that take surface analysis a step further. These parameters build on, or combine, basic parameters to produce numbers that describe a particular function, such as sealing, appearance, adhesion, etc. These values bring us closer to understanding how a given surface will function…and yet, they are still just numbers that need interpretation.
Visualization? Better.
In a musical score, the individual notes have meaning, but they don’t really make a song until you hear them being played by the orchestra (with the exception of the few people who can hear a score in their heads). Similarly, parameters are just numbers on the page…until you can see what they are trying to tell you about a surface.
The key word is “see.”
A 2D plot of a surface profile tells a vast amount more about a surface than a single parameter. A 3D image of a surface takes it to a different level, showing trends in all directions that a single trace may miss.
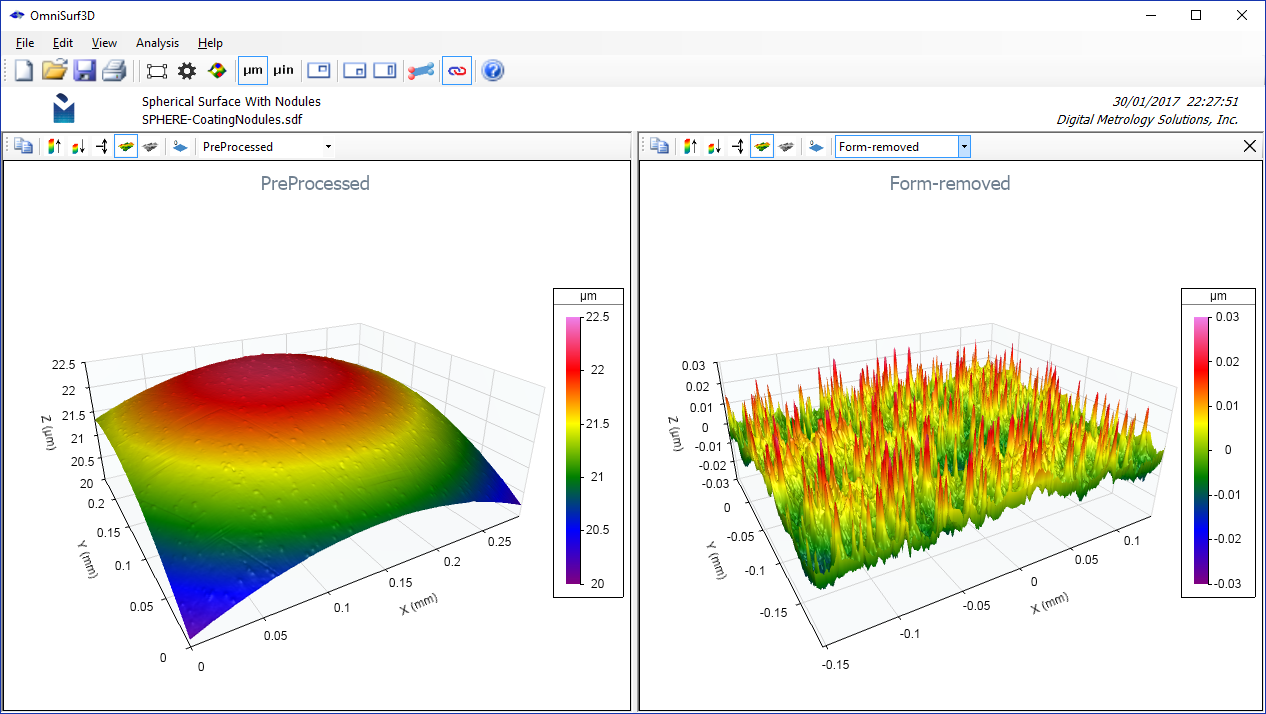
This view from OmniSurf3D software shows the raw 3D (areal) data on the left, and the same data with form removed on the right. Seeing the data at each step of analysis is a powerful key to understanding the nature of the surface.
We interact with surfaces nearly every waking minute of our daily lives—so much so that we tend to take everyday surfaces completely for granted. Our minds have all kinds of tricks for interpreting surfaces—many of which we are only vaguely aware of—so seeing and visualizing a measured surface first-hand is an incredibly powerful tool for understanding it.
But, of course, our eyes can play tricks on us, and details can escape us. Are those actual spikes or maybe noise in the measurement? Is the surface really tilted, or is it just being skewed by a few bad pixels? While seeing a surface is a powerful tool, it is also not the entire toolkit.
Interaction? Now we’re talking!
What’s needed is the ability to see and interact with a surface. Being able to suppress/repair bad or missing pixels, apply and adjust wavelength filters on the fly, select and display various parameters, and (the important part) see the effect of our changes in real time, is by far the most effective way to understand and improve surfaces. Interactive analyses, such as the Pit and Porosity analysis or morphological filters in OmniSurf3D, let you explore surfaces as you analyze them, to help you understand what is really important about a surface and how it will serve its intended function.

The interactive Pit/Porosity analysis in OmniSurf3D lets you see the material and voids at varying depth.
Interacting with surface data improves our interpretation of it. We can spin, tilt, or zoom in on data, just as we would with a physical surface in our hands. We can alter filter cutoffs and see which ranges of wavelengths impact performance. We can develop ways to analyze a particular surface for a particular function. And, we can share that knowledge, to collaborate on developing better parts, and solving production issues before they become quality problems.
OmniSurf3D allows you to interact with your surface data. You can even export animated GIF files for use in presentations.
The net result of all of this interaction and experimentation is a set of repeatable procedures and traceable parameters that can guide manufacturing processes. Exploration leads to a deeper understanding of a surface and its function, far beyond the raw numbers.
That’s what is “beyond Ra.”