
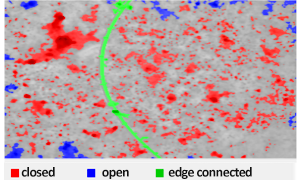
Using OmniSurf3D’s Pit/Porosity Tool
The Pit and Porosity analysis is a highly interactive tool that lets you slice through a surface to look at the voids/pores at every level. It makes it easy to visualize and explore potential leak paths, as well as calculating statistics to quantify surface porosity.

Can I measure waviness on a CMM?
Can we measure waviness on a CMM? That depends on two things: 1. Is my CMM accurate enough, and 2. Can a CMM stylus (ball) actually detect waviness? In this post we discuss the types of CMM systems and their suitability for measuring waviness.
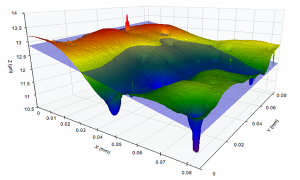
Areal Surface Texture Analysis for Both the Lab and the Engineer’s Desk
This tutorial discusses a step-by-step, visual approach to surface texture measurement. The process, which is the basis of the OmniSurf3D software, allows designers, managers, process engineers and lab staff to explore surface texture. OmniSurf3D provides a common language for understanding and communicating surface texture, to help improve component performance.
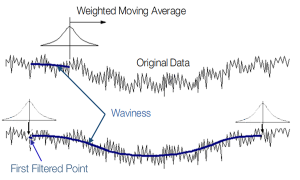
Controlling Roughness on Short Surfaces
Roughness control is important on many surfaces. Unfortunately, some of these surfaces can be relatively short – making it difficult to perform “traditional” roughness measurements. What if your surface isn’t that long? This post describes some available options when the evaluation length is short…as well as some things NOT to do…
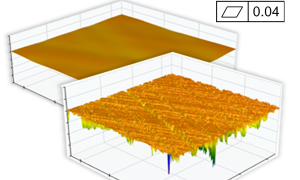
Flatness in the USA
Many mechanical interfaces depend on the control of “flatness.” So what do you do when presented with a simple flatness tolerance and a surface to measure? How many points does it take to accurately assess flatness on the particular sample? And, what kind of filtering/processing do we do with those points?
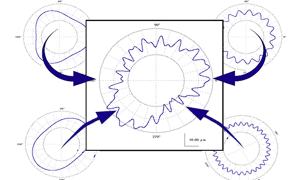
Harmonic Analysis of Roundness Data
“Harmonic Analysis” describes things that move (or shake) back and forth. The analysis tells you how many times bumps occur in each revolution of a rotating component. In fact, harmonic analysis actually looks at every frequency (every UPR) and reports how tall the bumps are for each of them. That’s a powerful analysis.
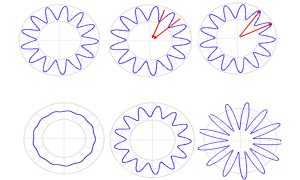
Tip Radius Selection for Roundness
The debate over measurement of roundness is centered around the tip radius and filtering used in the measurement. This debate is complicated by the fact that typical roundness graphs distort reality. Check out this post to learn more about the relationship between surface waveforms and tip radius, and what the debate is all about.
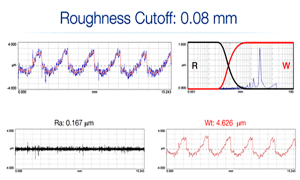
Filtering for Roughness and Waviness
This post includes an excellent animation (based on Digital Metrology’s training materials) that shows how the roughness and waviness profiles change with a changing filter cutoff. It is an excellent way to visualize a vital aspect of surface texture analysis!
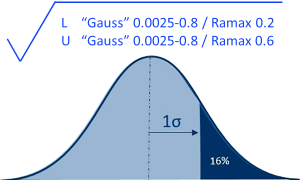
What’s with the “max”?
Ramax? Rzmax? These parameters appear on drawings but not generally in measuring systems. First off: “max” does not refer to a “maximum” or upper limit. The “max-rule” deactivates the ISO default “16% rule,” in effect saying, “No single trace on this surface is allowed to go outside this tolerance limit.” Let us explain further…