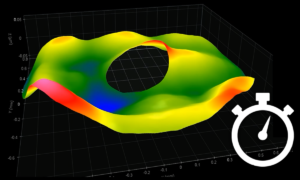
Just how fast can you analyze an asphere in OmniSurf3D?
Can you configure and analyze an aspheric surface in under a minute? With Digital Metrology’s OmniSurf3D analysis software, it’s easy. Watch this short video to see just how fast it can be! OmniSurf3D includes a set of tools for comprehensive asphere analysis. The process is not only easy, it’s very fast. Configuration can take less
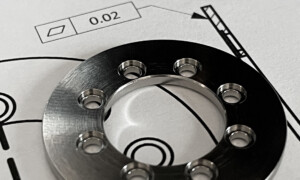
GD&T’s new rule and what it means for measurement
In a new article in Quality Magazine AJ Mennuti and Mark Malburg discuss the challenges associated with the release of ASME Y14.5-2018 and its new fundamental rule “s.” Rule “s” specifies that the evaluation of GD&T features includes every aspect of a surface’s texture and flaws. When measuring straightness, say, one must include the roughness,
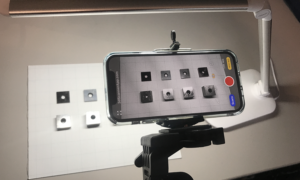
Surface metrology with a smart phone?
The iPhone 12 Pro includes LIDAR technology, primarily to improve the speed and accuracy of the camera’s focus. But you can also use it to map the shapes and sizes of objects. App developers are in the beginning stages of some amazing work to take advantage of this technology. But OmniSurf3D is already there…
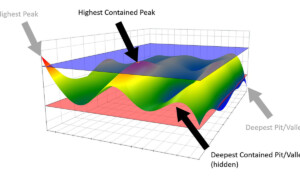
Image rotation and animation with OmniSurf3D
When it comes to understanding surface texture, one of the most powerful tools we have is an interactive visual of the surface. A 3D surface texture measurement tells a great deal about a surface, such as how features relate to each other—information that can only be hinted at by 2D measurements. 3D measurements help you
Measuring gear tooth waviness
Gear tooth waviness is a hot topic these days. As automobile engines have grown quieter, other noise sources, such as gears, are getting much more attention. We know that mid-wavelength waviness (two to three peaks per gear tooth) correlates to gear noise. What we have been lacking, however, are parameters that correlate to that noise,

Check out the “2D & 3D Parameters” podcast
Digital Metrology’s Mark Malburg was a guest speaker on Zygo Corporation’s recent podcast, “2D and 3D Parameters: Should you stick to the typical results?” Dr. Malburg and Carl Musolff, retired senior technical advisor from Cummins Corporation, joined host Tyler Kern to discuss how surface texture parameters are specified and measured in order to control component
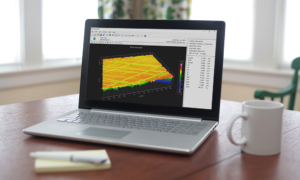
Surface analysis when working remotely
When you send parts to a measurement lab, you likely receive back a PDF file with some parameter values, and maybe a part profile. That’s probably just enough information for you to show whether the parts meet spec. But you aren’t likely to get any real sense of how that surface looks, feels, or performs.
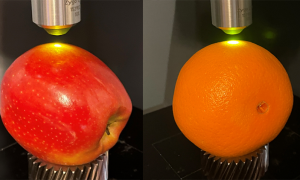
Comparing apples and oranges?
A properly scaled photo or graph can give great insight into surface texture features. An improperly scaled image, however, can get you running in circles. If you are trying to compare process data, an incorrectly scaled image may (incorrectly) suggest a change with your process, or it could mask an actual, lurking problem.
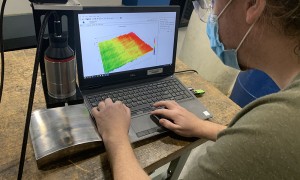
Surface texture analysis in the classroom
The majority of students entering machining and design occupations only received a slight introduction to surface texture analysis. Daniele DeFranceschi, a professor in the School of Engineering at St. Clair College in Windsor, Canada, is working to change that. Tools such as OmniSurf and OmniSurf3D help by making it easy to visualize and explore surfaces.