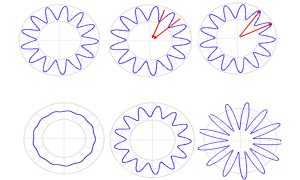
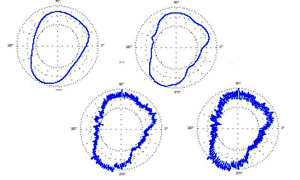
Tip Radius Selection for Roundness
The debate over measurement of roundness is centered around the tip radius and filtering used in the measurement. This debate is complicated by the fact that typical roundness graphs distort reality. Check out this post to learn more about the relationship between surface waveforms and tip radius, and what the debate is all about.
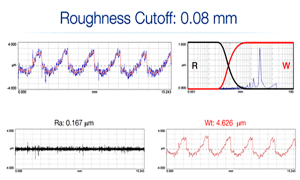
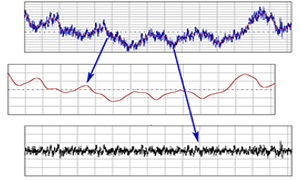
Filtering for Roughness and Waviness
This post includes an excellent animation (based on Digital Metrology’s training materials) that shows how the roughness and waviness profiles change with a changing filter cutoff. It is an excellent way to visualize a vital aspect of surface texture analysis!
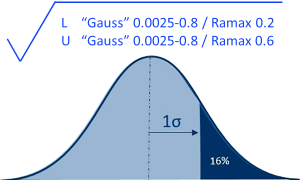
What’s with the “max”?
Ramax? Rzmax? These parameters appear on drawings but not generally in measuring systems. First off: “max” does not refer to a “maximum” or upper limit. The “max-rule” deactivates the ISO default “16% rule,” in effect saying, “No single trace on this surface is allowed to go outside this tolerance limit.” Let us explain further…
Calibrating a Roundness System
Calibration of roundness measuring systems is often misunderstood and misapplied. In roundness measuring systems “Calibration” often refers to the process of adjusting the system. Typical roundness systems come with a few extra items that can help with calibration and/or adjustment. So, can you “calibrate” with them?
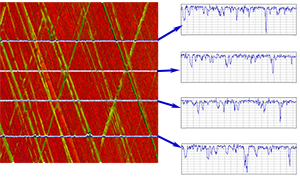
How to Plot Surface Texture
In order to control a process, it is likely that you will need to see the surface. A surface texture plot is often more important than the parameter value. Many people provide profile graphs with their measurements—the good ones provide consistent, fixed scaling so that the graphs look the same between measurements.
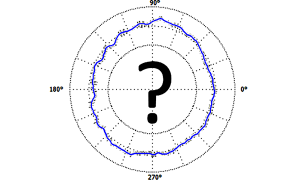
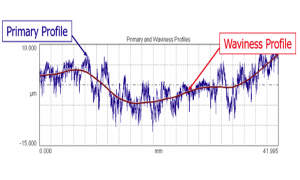
Tutorial: What do you mean by “Roundness”?
This tutorial discusses aspects of measuring roundness, including the concept of roundness as long-frequency form, the short frequencies that we refer to as roughness, and the effects of employing a cutoff filter frequency.
Understanding Surface Texture in 3 Easy Steps
“I have a surface finish specification. Where do I begin?” “I’m new to the field of surface measurement. What do I need to know?” This tutorial is provided to help you hit the high points of surface measurement, including roughness, waviness, filtering, and basic surface texture parameters.
Can I do R&R Studies on my surface Finish Gage/Gauge?
People often ask, “How do I do R&R (Repeatability and Reproducibility) studies for my surface finish instruments?” A better question may be, “Should I use an R&R study when dealing with surface finish?” Often the answer should be, “No!” In other cases, the answer could be, “Maybe, but be very careful.”