Losing our marbles?
Here’s a fun “macro” example of an important aspect of micro surface texture. Peak curvature is a measure of the “sharpness” of the small peaks in a surface. Many papers have been written on this important tribology parameter because it relates directly to a number of surface functions. But if you’re trying to estimate peak

Training Beyond School: Carl Musolff’s career as metallurgist, metrologist, and mentor
Engineers often wish there was a particular expert in the room to help them navigate the journey from problem to solution. For some very fortunate engineers, Carl Musolff has been that expert. Carl Musolff has made a career of solving challenging problems, for engines of every shape and kind. But what he really loves is
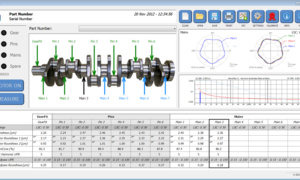
A power boost for your measurement system
Most measurement systems ship with software for acquiring data and displaying it in generalized ways. But what if you need to calculate special parameters, or display data in a way that’s unique to your process or application? Custom software tools, or “helper applications,” can pick up where off-the-shelf instrument software leaves off, filling in features
What am I missing when I only measure average roughness?
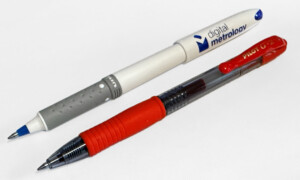
Here are two of our favorite pens: the “Uniball Grip” that we use with our logo, and the Pilot G-7 that we use for the Notepad Series. Both are relatively inexpensive, but they both write very well, and both grips feel great to hold. Speaking of “feeling great,” we put the pen grips under the
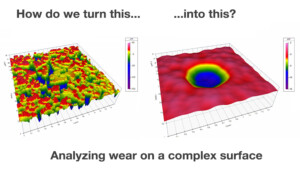
Where is the wear?
A joint post with Michigan Metrology. How would you measure the wear on this porous surface? This friction material was subjected to a laboratory wear test and measured by Michigan Metrology, using a Bruker NPFlex optical profiler. It has been worn at the center, and we need to know the depth of that wear
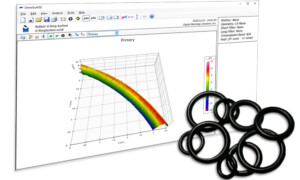
Measuring the surface of an O-ring
Here’s a challenging measurement. We want to look at the surface texture of this O-ring: With a small radius and cross-section, steep sides, and soft material, it’s almost impossible to measure with a stylus. An optical system can do the job, though. Here’s a measurement made with a Zygo ZeGage at 10X magnification, shown in

Are those valleys in my measurement data real?
Can I trust my measurement? Asking that question every time we measure drives us to be careful—and that keeps us producing meaningful results. Let’s look at a “simple” shop floor measurement of surface finish, made with a skidded instrument. And, let’s explore something that you might not imagine: “upward” dirt on the surface can cause
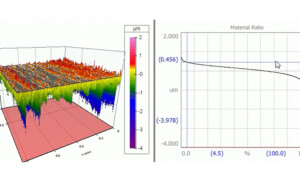
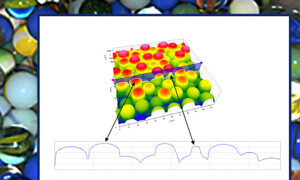
The Material Ratio Curve
The “material ratio curve” tells us how much material we encounter (as a percentage) as we slice through a surface at various depths. You may also see it called the Abbott-Firestone Curve (based on the two engineers who developed it) or the Bearing Ratio Curve. The curve appears is a standard component of our OmniSurf,
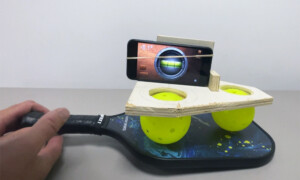
Pickleball paddles: does “rougher” equal “more friction?”
It seems like the sport of Pickleball is everywhere these days! It’s definitely a game of skill…but having the right equipment doesn’t hurt, either. We were curious how big a difference there might be between Pickleball paddles, so we put a couple under the microscope (this is the kind of thing we do for fun).