Creating a Presentation from Data
In this 60-Second Surface Analysis video we show how to load data from OmniSurf3D into a PowerPoint presentation in just a few clicks. It's an incredible time-saver, especially when you have a large amount of data to share.
Read More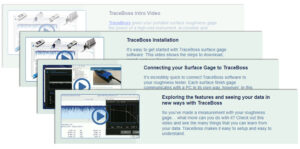
TraceBoss videos
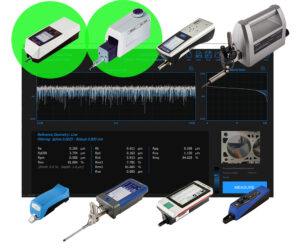
TraceBoss now supports Mitutoyo Roughness Testers!
TraceBoss now supports Mitutoyo's SJ Series roughness testers! Now you can see and explore your surface data with the SJ-210, SJ-410 (Sj-411, SJ-412), SJ-400, and other models. Visit the TraceBoss page for the full line of supported instruments, and see why TraceBoss has quickly become essential software for so many shops!
If you have a Mitutoyo, you need TraceBoss!
Read More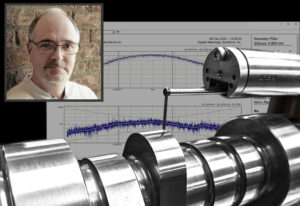
Finding performance—an interview with racing’s Billy Godbold
Video: Copying Measurement Settings with a Click in OmniSurf3D
OmniSurf3D software makes it easy to open and compare several surface texture datasets—a feature you don’t always get in other software. But even better, you can copy settings from one dataset to another with a click…so you’ll always know that you’re comparing apples and apples. We show you how to do it in this video.
Read More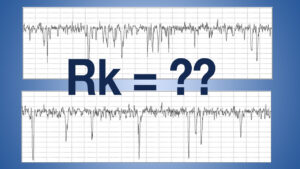
A Tale of Two Surfaces – Challenges with the Rk Parameters
If you work with plateaued surfaces, you're most likely familiar with the Rk surface texture parameters, based on the material ratio curve. But there are aspects of plateaued surfaces that the Rk parameters can't always detect. This is where the Rq parameters come in. In this Surface Notes blog post we look at this important limitation of Rk parameters, and how the Rq family can help.
Read More
Notepad Series Video: Measurement Settings
The measurement settings for roughness gages can be intimidating. There are a lot of options, and it's not always clear what they do, or which are most important. In this video we make it easy for you as we point out the two most important settings: the wavelengths which define “roughness” (filtering and cutoffs), and the length of data we would like to evaluate (evaluation length).
Read More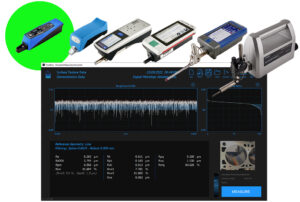
TraceBoss now supports LITEsurf
TraceBoss now supports the LITEsurf roughness tester from SM Metrology Systems! Now you can see and explore your surface data from an even wider range of handheld roughness gages. Visit the TraceBoss page for the full line of supported instruments, and see why TraceBoss has quickly become essential software for so many shops!
Read More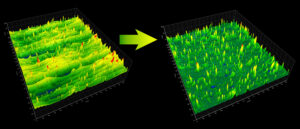
Analyzing additive surfaces with directional filters
In laser powder bed fusion (LPBF), an additive manufacturing technique, manufacturers sometimes need to know the size and number of partially melted powder particles on the finished surface—but isolating them from the “striped” pattern created by the additive layering process is a challenge. In this blog post we show how directional filtering, a standard feature in OmniSur3D, makes it easy to isolate the particles from the larger layered pattern.
Read More
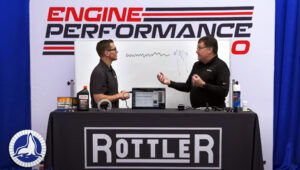
Engine Performance Expo
We had some amazing sessions last week at the Engine Performance Expo. When you get this many high performance enthusiasts in the same room, it's bound to be a blast! We'll share some excerpts with you over the next days and weeks.
In this session from Day 2 Digital Metrology's Mark Malburg got to talk with Lake Speed, Jr. about cylinder bores, "the most engineered surfaces on the planet." If you can see the shapes of the texture as well as calculate the numbers, you can understand and improve critical surfaces like these. New tools like Total Seal's Surface System with Digital Metrology's TraceBoss and HatchView software help connect the numbers back to the craftsmanship—and that combination leads to excellent engines.