Read our “Hidden Waviness” article in Quality Magazine
Our new article, “Hidden Waviness: When measuring roughness cannot solve quality challenges,” appears in the June 2020 issue of Quality Magazine. This article was written in conjunction with Don Cohen of Michigan Metrology. Specifications for surface texture frequently focus on surface “roughness”—the finer structures in the texture—often to the exclusion of the “waviness”—the larger structure
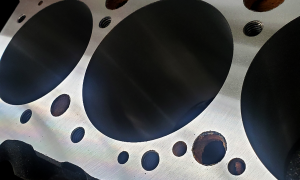
How big is that 3D dataset?
When we look at an areal (3D) measurement of a surface it can appear as a vast landscape of many sizable features: An optical, areal measurement typically includes millions of points. On the other hand, a stylus-based, 2-dimensional measurement typically includes just thousands of points. But just how big are the areas covered by these
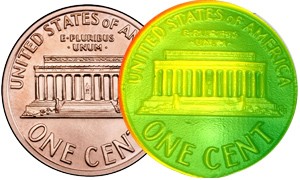
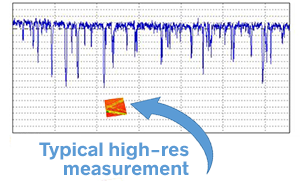
How much does it cost to compare measurement systems? The answer: one cent.
Optical measurement of surface texture is becoming more and more widespread, and new technologies are providing faster measurement of larger areas. However, in the quest to measure faster over larger areas, we sometime lose touch with the ability to resolve smaller features. Most of the time there are hints at performance in the measuring system’s
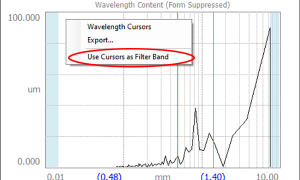
Interactive bandpass filtering
Many surfaces are dominated by a repeating, pattern or shape in their texture. Sometimes this texture is desired, as on a gripping surface. Other times it is something we try to avoid, such as “orange peel” in paint, or chatter in a bearing raceway. In each of these cases it is helpful to isolate the
Read the March 2020 ‘Surface Matters’ Newsletter
Our third edition of the Digital Metrology Surface Matters newsletter is out! In these quarterly emails we keep you up to date on the latest in surface analysis, including new software to explore your surfaces, case studies to share successes, and even free upgrades to your existing tools. In the March edition we introduce you to
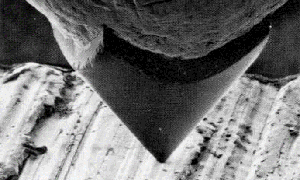
Can a stylus really measure this surface?
For many critical applications, companies are finding it necessary to not just assess the geometric aspects of the surface, but also the quality of the surface. You’ll find specifications with terms such as “torn and folded material,” “porosity,” “pull-outs,” “micro-burrs” and “micro-ledges.” The surface in the image above is marked by torn and folded material
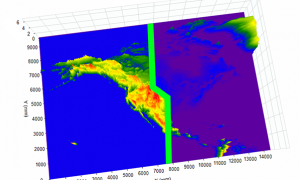
Optimizing the color palette to see surface details
Digital Metrology has addressed one of the most common problems in the display of areal/3D surfaces: The problem of the palette! In the image above you’ll see the new Smart Palette controls in our OmniSurf3D software being adjusted to emphasize the important features of the surface. How does it work? Let me explain… Our eyes
Read the December ‘Surface Matters’ Newsletter
Digital Metrology has recently launched the new Surface Matters newsletter. In these quarterly emails we keep you up to date on the latest in surface analysis, including new software to explore your surfaces, case studies to share successes, and even free upgrades to your existing tools. In the December edition we show our readers how to
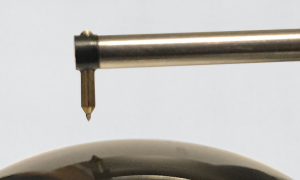
Measuring arcs with stylus instruments
Many critical surfaces are comprised of arcs or arc-like geometries. Measuring these surfaces with many traditional stylus-based instruments poses fundamental challenges. In this post we look at several considerations that may affect your ability to properly measure arcs and understand your curved surfaces.